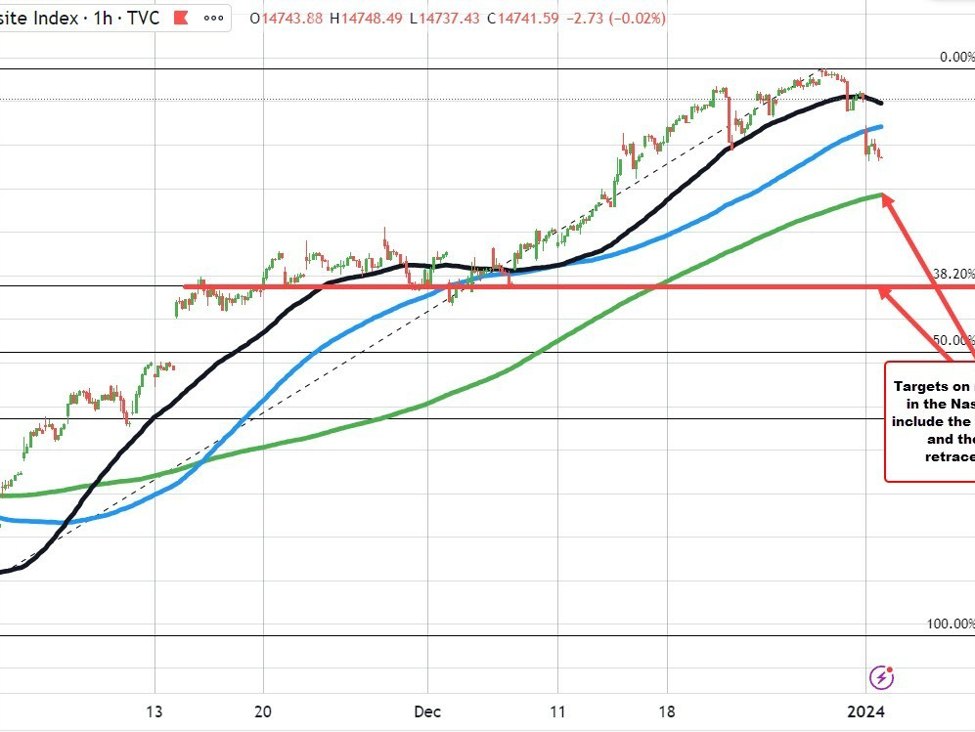
The Nasdaq index is trading back down toward its lows for the day. The index is down -274 points or -1.80% at 14740.31. The low for the day reached 14723.75 today.
The fall is the largest decline since October 25. Since that fall, the index had been up for 9-consecutive weeks.
Nasdaq index is sharply lower
Technically, the rebound off of the earlier session low was able to stay well below its 100-hour moving average. That moving average comes at 14882.25. It would take a move back above that moving average to give the buyers more confidence.
On the downside, the rising 200-hour moving average comes in at 14569.03 (green line on the chart above).
The sellers have the “bit in their mouth” and they are trying to keep that pressure on the index. With a 9 -week win streak, it is not so hard to think of a downward corrective move in the index. The inability to get close to the 100-hour moving average on the bounce today and the move back down is indicative of the sellers starting to tilt the tide more in the downward direction.
Meanwhile, the S&P index is down -36.46 points or -0.77% at 4733.35. The Dow Industrial Average is also lower by 45 points or -0.12% at 37645.
