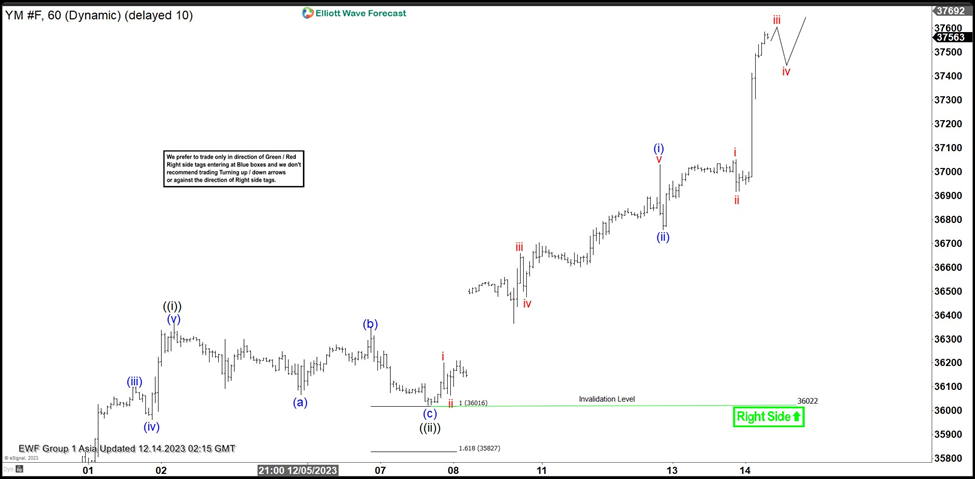
Dow Futures (YM) has broken to new all-time high, suggesting the trend remains firmly bullish. It also suggests the next bullish cycle has started. Short term, rally from 11.10.2023 low is currently in progress as a 5 waves impulse Elliott Wave structure. Up from 11.10.2023 low, wave ((i)) ended at 36337 and dips in wave ((ii)) ended at 36022. Internal subdivision of wave ((ii)) unfolded as a zigzag structure. Down from wave ((i)), wave (a) ended at 36066, wave (b) ended at 36352, and wave (c) lower ended at 36022. This completed wave ((ii)) in higher degree. Index has resumed higher in wave ((iii)) and broken to new all-time high.
Dow futures (YM) 60 minutes Elliott Wave chart
Up from wave ((ii)), wave i ended at 36201 and wave ii ended at 36064. Wave iii higher ended at 36659, wave iv ended at 36476, and wave v higher ended at 37030. This completed wave (i) in higher degree. Pullback in wave (ii) ended at 36758. Index has resumed higher again in wave (iii). Up from wave (ii), wave i ended at 37051 and pullback in wave ii ended at 36917. Expect wave iii to end soon, then Index should pullback in wave iv, and then extend higher again. Near term, as far as pivot at 36022 low stays intact, expect pullback to find support in 3, 7, or 11 swing for further upside.

