USDCAD trades to a new high but upside resistance looms
The USDCAD has recently reached a new daily high, but the price movement has been notably volatile, fluctuating between gains and losses. This inconsistency in the market’s direction forms the backdrop of current trading conditions.
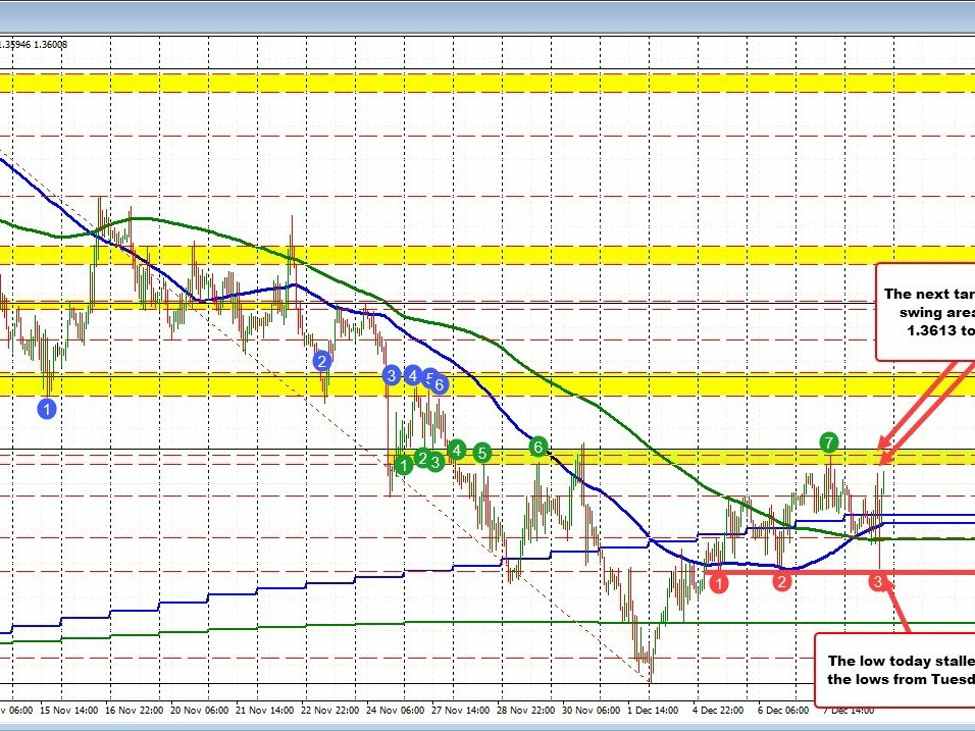
On a positive note, today’s low, which occurred during the New York session, managed to halt just before reaching the 1.3547 level. This level is significant as it was previously identified as a swing low on both Tuesday and Wednesday. Following this, there was a push upward, surpassing the day’s earlier high at 1.3607, albeit marginally by a pip or two, which does not strongly signify a bullish trend.
However, traders may find solace in the existence of a defined resistance zone between 1.3613 and 1.3622. This range includes the critical 38.2% retracement of the decline from the November high, located at 1.36224. Knowing this ceiling is crucial for traders: it presents a potential resistance level to sell against or, conversely, a threshold that, if broken, could enhance the bullish sentiment and trigger further upside exploration.
At present, there’s a cluster of Moving Averages (MAs) within a tight range, including the 200-hour MA at 1.3566, the 100-hour MA at 1.3576, and the 100-day MA at 1.3582. These MAs are important indicators, acting as a barometer for the market’s sentiment – bullish if above these levels and bearish if below.
Currently, the market is leaning towards a bullish bias, being above these MA levels. For the buyers to assert more control and maintain the upward momentum, a break above 1.3622 is essential. Conversely, if the price falls back below these MAs, it could indicate a loss of buyer momentum, potentially leading to a bearish shift. A decisive break below 1.3547 would further confirm this bearish control, signaling sellers taking the upper hand in the market dynamics.
