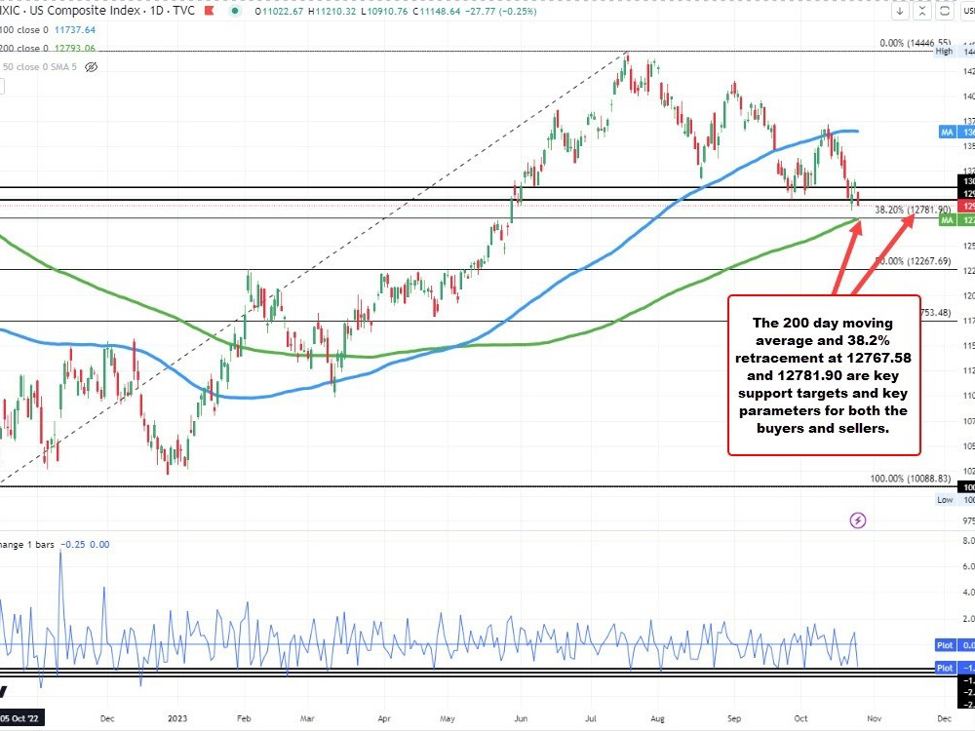
NASDAQ index moves closer to key technical support
The NASDAQ index continues its run to the downside and it currently trades down -1.77% at 12906. The index is working toward being one of the top 10 down days for the year.
The biggest move lower was back on February 21 when the index fell -2.5%. More recently on October 3 the index fell -1.87%, on August 24 it also fell -1.87%, and on September 21 it fell -1.82%.
Technically,, the price is moving closer to the low price from Monday’s trade at 12848.83. Below that, and traders will be targeting the 38.2% retracement of the move up from the October 13, 2022 low and the rising 100-day moving average at 12781.90 and 12767.59 respectively.
Both of those technical levels are key parameters for both buyers and sellers. Move below and we could see further selling momentum on the technical break. Stay above and the market can breathe a sigh of relief.
Meanwhile, the broad S&P index today has moved back below its 200-day moving average at 4238.50 (see green line in the chart below). Recall that on Friday and Monday, the price closed below the moving average for the 1st time since March 17. Yesterday, the price rebounded back above the moving average level and closed above. That bounce was short-lived with the move back below the MA today. On the downside, the 38.2% retracement of the move up from the October 13 low comes in at 4180.95. That will be the next key target on the downside for the broader S&P index.
S&P index back below the 200 day moving average
.
