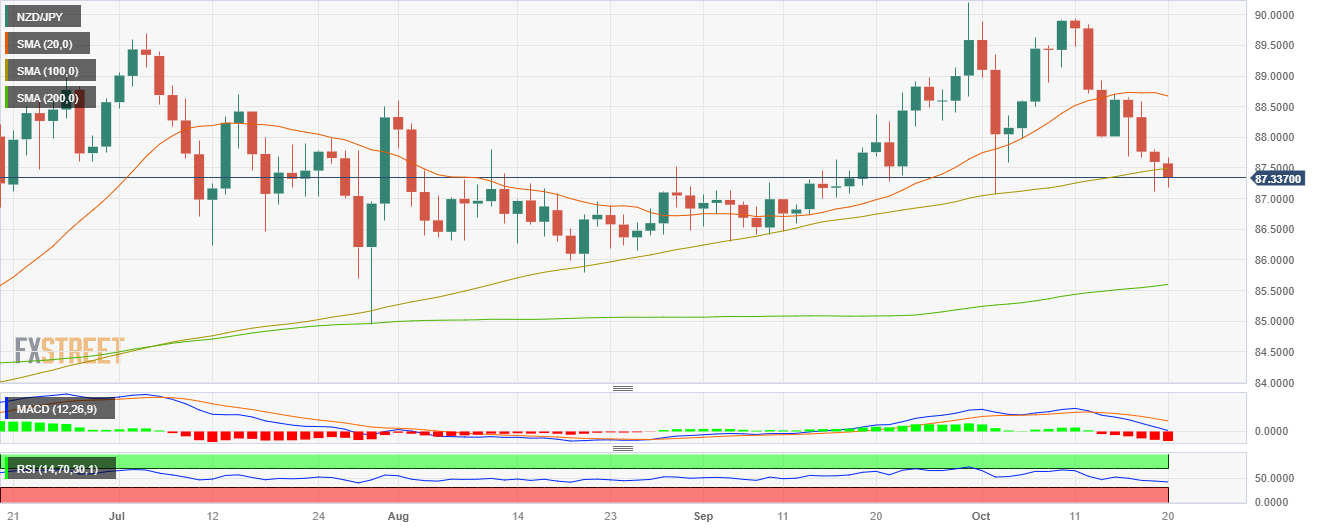
- NZD/USD saw 0.30% losses declining near 87.30 .
- The cross tallies a four-day losing streak and will close a 0.80% losing week.
- For the first time since April, the pair trades below the 20 and 100-day SMA.
In Friday’s session, the NZD/JPY continued facing selling pressure, seeing losses for a fourth consecutive day. The bears breach the 100-day Simple Moving Average (SMA), and the outlook is starting to tilt in favour of the bears in the daily chart.The Relative Strength Index (RSI) exhibits a negative slope below the 50 threshold, approaching the oversold condition, while the Moving Average Convergence (MACD) histogram displays larger red bars. Furthermore, the pair is above the 20 and 100-day Simple Moving Averages (SMAs) but below the 200-day SMA, pointing out that the long-term trend currently favours the bulls.
The bearish sentiment is more evident on the four-hour chart, with indicators approaching oversold conditions and the RSI leaping towards the 30 area. That being said, a technical correction in the next sessions may be on the horizon, but in the short term, the sellers have the upperhand.
Support levels: 87.122, 86.505, 86.300.
Resistance levels: 87.500 (100-day SMA), 87.805, 88.300.
NZD/JPY Daily Chart

