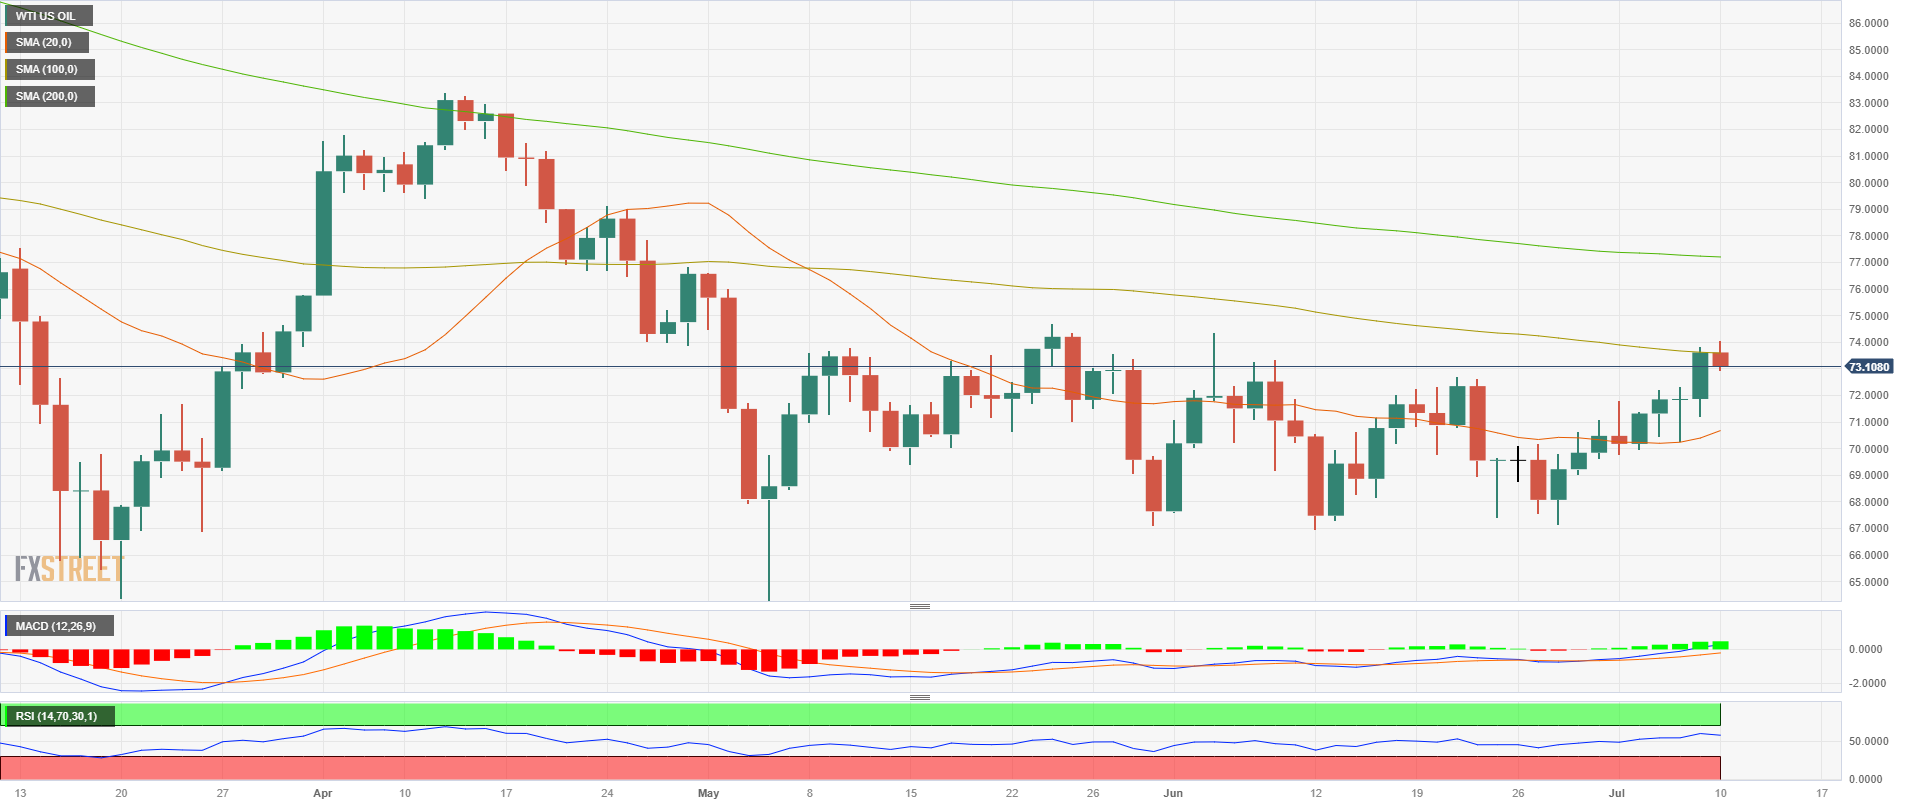
- The WTI price trades with losses near the $73.00 area, cutting a four-day winning streak.
- Weak NFPs from the US and dovish bets on the Fed made Oil prices rally on Friday.
- Eyes on inflation data from the US on Wednesday.
At the start of the week, the West Texas Intermediate (WTI) barrel trades with losses as investors take profits after closing a 4.63% weekly gain last Friday. Weak Nonfarm Payrolls (NFP) made investors bet on a less aggressive Federal Reserve, favouring a positive market environment—eyes on crucial Consumer Price Index (CPI) data on Wednesday.
Despite investors betting on a dovish bet amid lower-than-expected NFPs, they should keep an eye on sticky wage inflation as Average Hourly Earning increased in June, higher than the expected figures. In that sense, sticky prices give the Fed reasons to continue hiking so Wednesday’s CPI figures will be crucial to give markets a better outlook of the US inflationary situation. As for now, markets are expecting the CPI headline figure to drop to 3.1% YoY in June from 4% and the Core measure to 5% from its previous 5.3%.
It’s worth noticing that higher interest rates cools down economic activity and hence lowers Oil demand, pulling down its price, so hawkish bets on the Fed may fuel further downside for the WTI. As for now, the FedWatch tool suggests that a 25 basis point (bps) hike is already priced in for the next July meeting and the probability of another hike in 2023 hovers around 40%.
WTI levels to watch
On the daily chart, the technical outlook is neutral to bullish for the WTI. To confirm its positive stance, the bulls must consolidate above the 100-day Simple Moving Average (SMA) at $73.56 which could pave the way for another upwards leg. In addition, the Relative Strength Index (RSI) stands in positive territory, as well as the Moving Average Convergence Divergence (MACD)
Resistance levels: $73.56 (100-day SMA), $76.00,$77.80.
Support levels: $71.90,$70.60(20-day SMA), $69.50.

