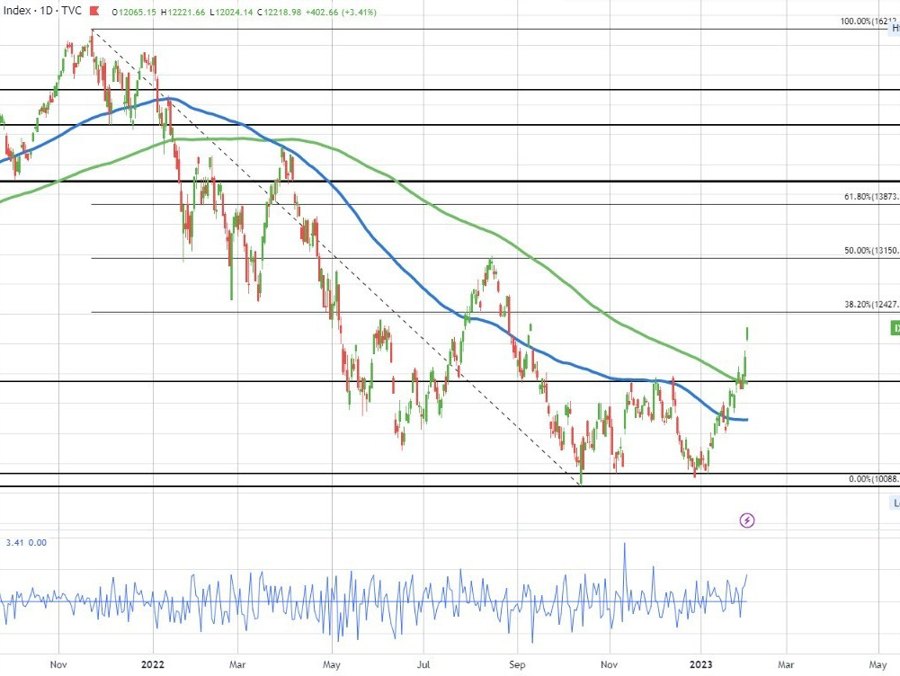
The NASDAQ continues its scorching rise higher. It Is currently up 396.2 or 3.35% at 12212.77.
That leads the way for the major indices.
- The S&P is up 63.41 oiubts or 1.53%
- The Dow Industrial Average is still lower by -93 points are -0.27%.
- The small-cap Russell 2000 is also having a good day with a gain of a 40 point or 2.07%.
Looking at the NASDAQ on the daily chart, the move down from the November all-time high has the 38.2% retracement at 12427.97. Although still 200 points away, it is fast approaching with the gap higher and run to the upside in trading today. The price is also running away from the 200 day MA currently at 11473.68 (green line). The price had not closed above the 200 day MA since January 13, 2022 before last Friday.
Moreover the NASDAQ has been up 1.67%, 2.0% and now 3.41% in successive days. From the closing level on Monday at 11393, the price has moved up 7.44%. Back in July, the price was up 7.16% from the close on July 26 to the close on July 29. Going back to March 14, the 3-day gain then saw the price move up 8.49% over the next 3-days) .
The S&P index is up nearly 20% from its lows seen in October. A gain of 20% is characterized as a bull market .
The NASDAQ index is already there with a gain of 20.62% from the low to the current level.
