The EURGBP took a turn to the downside earlier this week after an ECB “sources” story saying that the pace of the hike for the ECB was to slow.
That gave the sellers the go-ahead to push lower.
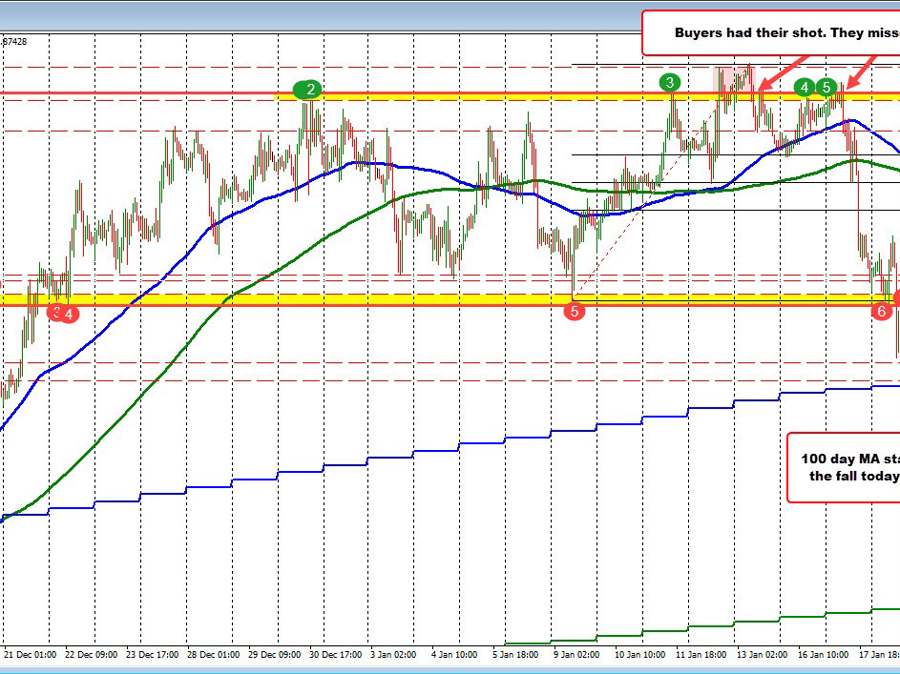
Helping technically, was that earlier in the day, the price tried to move back above what was a ceiling near 0.8876 to 0.8880 (highs from December 30 and again on January 11). Admittedly, the price moved above that swing area on January 12 and January 13 with each attempt failing.
Buyers had their shot. They missed.
The run lower on Tuesday saw the price move down toward the lower swing area between 0.8765 and 0.87713. That low area along with the high swing area between 0.8876 and 0.8809 had encompassed most of the trading since December 22 (see Red Box on the chart above).
The price ultimately fell below that level late yesterday and closed at 0.8743.
In trading today, the buyers reentered and pushed the price back into the “Red Box”, but could not sustain the move, and rotated back lower . The run to the downside and lows today tested the 100 day moving average at 0.8722 (blue step line on the chart above). The low price for the day reached 0.872124 right below that MA level. Buyers were leaning. The price is currently trading back up at 0.8741.
What next?
Like at the highs last week and on Tuesday, the sellers are now getting their shot to push the price lower in this pair. Fundamentally, ECB comments helped the downside momentum. However, there has been counter comments since saying that the central bank is still on a 50 basis point hike per meeting path. We will see what they say after the next meeting.
In the mean time, I am not surprised to see buyers stall the fall at the 100 day MA, but can they get back in the Red Box and stay in that box? If not, the 100 day MA will be in jeopardy of being broken for the first time since December 16.
Sellers are taking their shot, but the buyers are still fighting with the 100 day MA as their technical ammunition.
