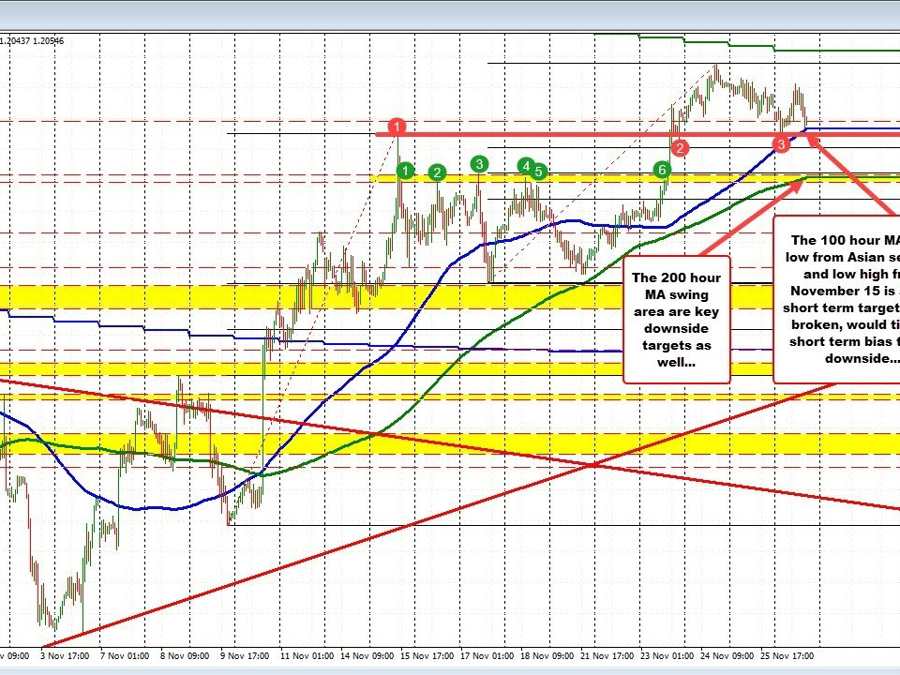
The GBPUSD has moved down to retest the 100 hour MA, the high price from November 15 and the Asian session low. All those levels come in between 1.20247 and 1.2036. A move below that area would tilt the short term bias to the downside from a technical perspective, with more work to do for further control. The low in the NY session reached 1.2038 and bounced.
Looking at the hourly chart, a move below 1.20247 would have traders looking toward the 38.2% of the last move up from the November 17 low at 1.2004. Below that and the 200 hour MA at 1.1950 would be targets. That MA is within a swing area between 1.19416 and 1.19543 which would another target to get to and through on the down.
Looking at the daily chart below, the move lower took the price back below the 1.20499. That level is the 50% of the 2022 range. Stay below also opens the downside door up on the failure to stay above. The buyers have taken their shot. It may be failing.
On the topside, the falling 200 day MA is a key level this week if the price should rotate back to the upside. That MA comes in at 1.21752. The price has not closed above the 200 day MA since mid September 2021.
