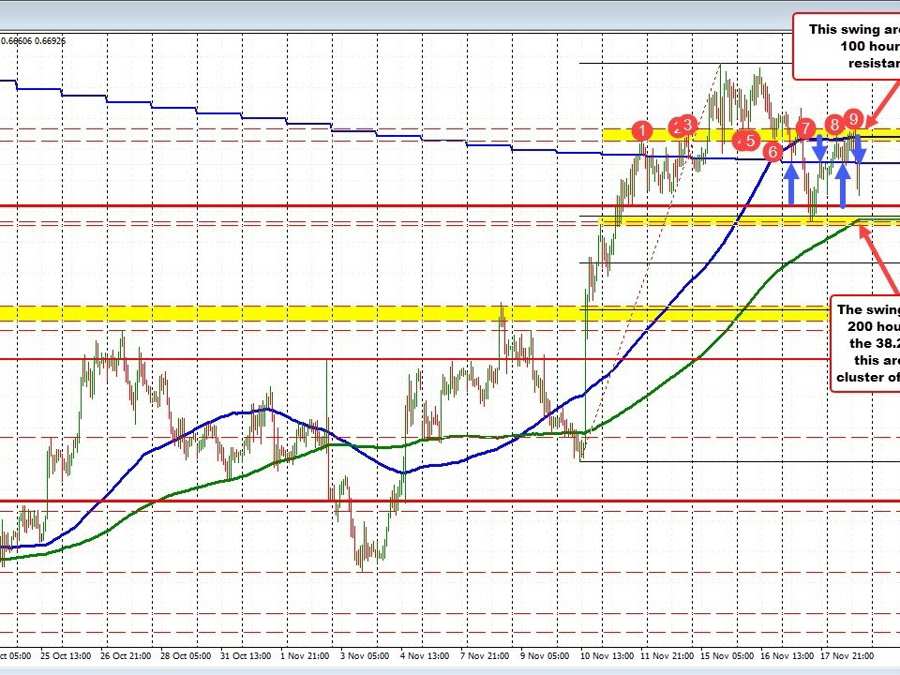
The AUDUSD has been trading above and below the 100 day MA over this week (see blue arrows). The week started with the pair consolidating the gains from last week and just hung around that MA level. On Tuesday, the price moved higher, reaching the high for the week at 0.6797. On Wednesday when that high could not be reached or breached, buyers turned to sellers and a retest of the 100 day MA was initially made in the Asian session.
Since that test, the price action moved back below the MA and corrected back toward it into the close yesterday. Today, the price moved above the 100 day MA in the Asian session and tried the upside, only to have the price move back below the MA in the US session today. The price is back up retesting the 100 day MA once again. Can the sellers keep a lid on pair at the 100 day MA?
What we know is the last two days has seen moves above and below that 100 day MA level, BUT with limits to the breaks to the upside and to the downside. What are those limits?.
- On the topside,, the 100 hour MA currently at 0.67213, and a swing area between 0.67168 and 0.67294 represents the topside target.
- On the downside, the 38.2% of the move up from the November 10 low at 0.6640, the rising 200 hour MA and a swing area down to 0.66299 provides the support target.
Focus right now… the 100 day MA again.
Meanwhile, the US stocks have seen earlier gains lose some of the steam. The major indices are trading near the lows.
