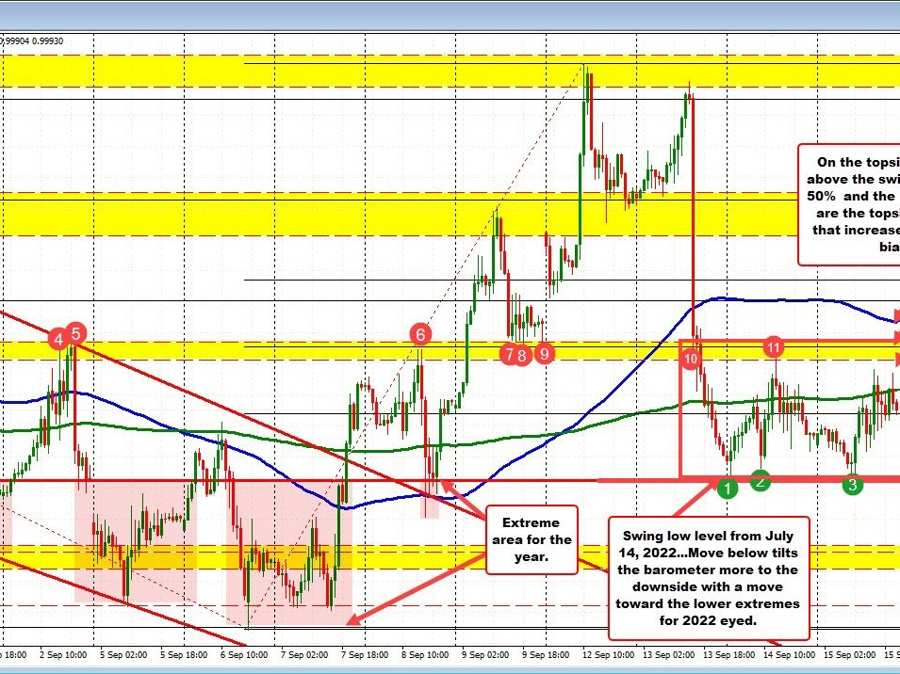
The EURUSD is mired in at 62 pip trading range for the day. The high extended to 1.0017. The low reached 0.99551.
On the topside, the high stalled ahead of the low of a swing area (see red numbered circles) betweeen 1.00226 and 1.00328. On the downside, the pair stalled ahead of the 0.99515 level. That level was the swing low going back to July 14 (the stall point in that month – see daily chart below). The price fell back below the 0.99515 level on August 22 and traded below it during 10 trading days in August and into September. However, the last 7 days have closed above that level and the last three days have had bottoms between 0.99547 and 0.9965.
I consider the level a barometer in the short term. If the buyers can stay above, the market stays above the extremes for the year (and going back to 2002). If the price moves below, a run to the low is likely.
Buyers and sellers are consolidating the pair and awaiting the next shove. IN the short term I give the bias to the sellers. THe price is below the 100 hour MA (blue line on the hourly chart) and the 200 hour MA (green line) currently. However,, if the sellers are to increase control, the price needs to move away from the 200 hour MA , and make a run to and through the 0.99515 level. Absent that, and the higher levels (1.0022 to 1.0032) and the 100 hour MA will be the path of least resistance for traders as they get frustrated with the lack of follow through selling after the CPI data this week.
