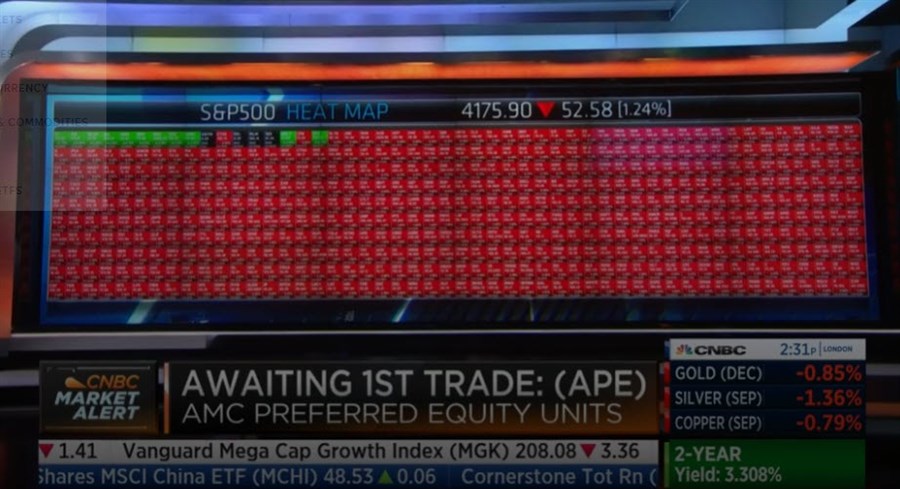
The major US indices are opening up lower on the day. There is a lot of red on the S&P 500 heat map with only a handful in the green (or up).
A snapshot of the markets are showing:
- Dow is down -403 points or -1.20% at 33294.89
- S&P is down -60 points or -1.43% at 4167.86
- Nasdaq is down -220 points or -1.76% at 12483.92
- Russell 2000 is down -31 points or -1.64% at 1924.91
Last week, the S&P index climbed up to test it’s falling 200 day moving average (green line in the chart below). Sellers leaned against the level and the last 3 or 4 trading days are to the downside. Today the price Below the 50% midpoint of the range for the 2022 trading year that level comes in at 14227.75 and is now topside resistance. The 100 day moving average at 4290.96 is the next big target support level on the downside.
This article was originally published by Forexlive.com. Read the original article here.
