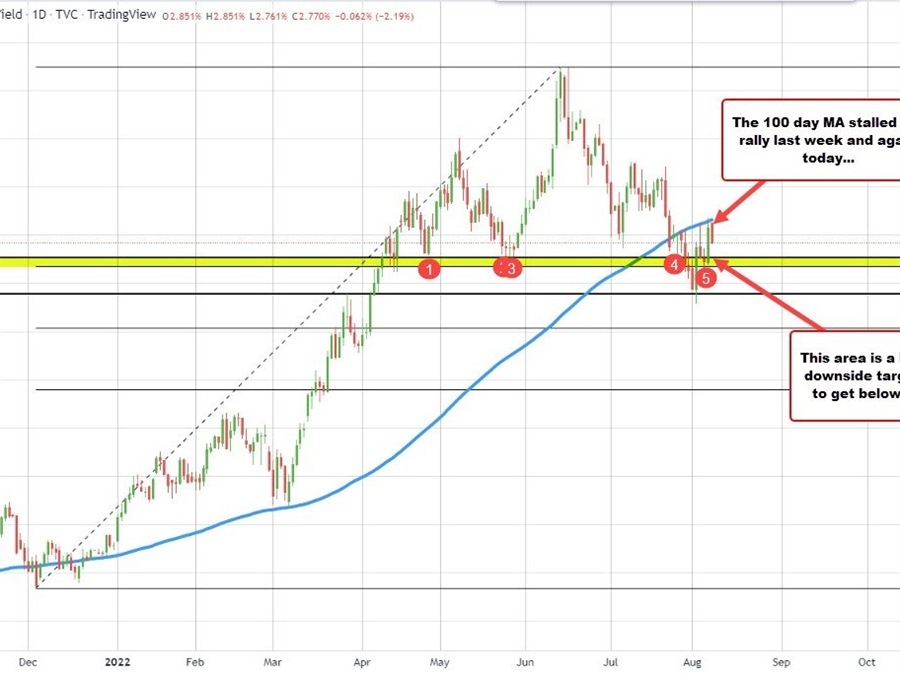
The US 10 year yield moved up to test the 100 day MA on Wednesday and again on Friday last week (blue line in the chart above).
Today the high yield of 2.851% also sniffed the MA level at 2.862%. Staying below the moving average keeps the lid on the rates. It would take a move above to get a technical boost in that yield.
The current yield current yield is at 2.768%. The end of April low and May lows came in near 2.706%. A move back below that area and then the 38.2% at 2.6719% would tilt the bias more to the downside going forward.
So 100 day MA is resistance above and the 38.2% is the low of the support target.
This article was originally published by Forexlive.com. Read the original article here.
