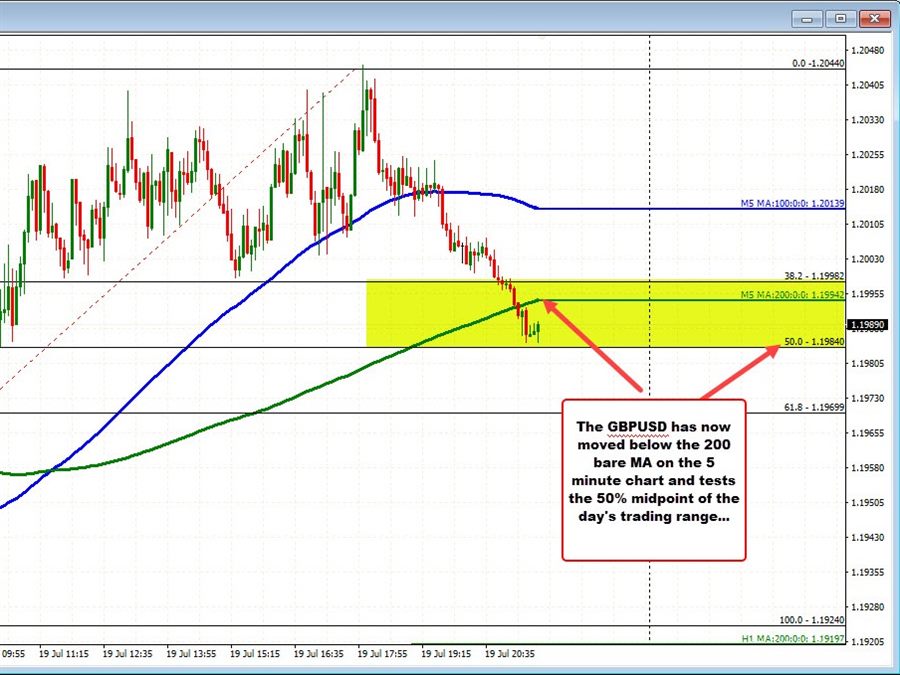
The GBPUSD has now moved back below the natural support at 1.2000 and has seen some liquidation of some long positions.
The price has moved down to 1.19850.
Looking at the 5 minute chart above, the pair is testing the midpoint of the day’s trading range and is back below the rising 200 bar MA on the chart as well. A move below the midpoint at 1.1984 would give sellers more confidence.
The pair is still higher on the day with the price moving to the 50% of the move down from the June 27 high at 1.20456. The inability to move above that level gave sellers a reason to enter (or buyers a reason to take profit) .
This article was originally published by Forexlive.com. Read the original article here.
