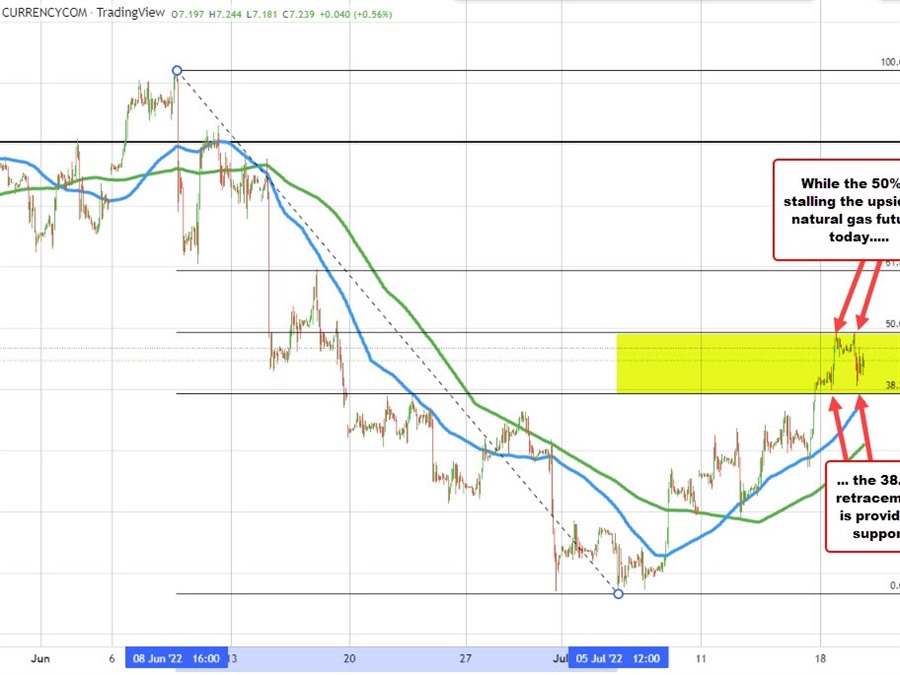
Natural gas futures moved up to a high price today of $7.46 before topping and rotating marginally to the downside. The current price range that $7.23.
Looking at the hourly chart the recent cycle high peaked on June 8 at $9.65. The subsequent move to the downside saw the price move down to $5.32 on July 5. Since then the price has rotated back to the upside breaking above the 100 hour moving average on July 7 and the 200 hour moving average also on July 7. The price re-tested the 200 hour moving average back on July 8 and again on the July 12 before running back to the upside.
Today’s high price reached the corrective high off the low that $7.465. That level stalled right near the 50% midpoint of the move down from the June 8 high at $7.468 Sellers leaned on two separate tests increasing the levels important going forward. Stay below and the sellers are in play with the 38.2% retracement of $6.96 followed by the rising 100 hour moving average at $6.89 as the next downside targets (move below each is more bearish).
Conversely, a move above the 50% retracement would open the door for further upside momentum with a 61.8% retracement at $7.97 corresponding with the swing high from June 16 near the same level.
