The EURUSD is higher on the day, moving off an Asian session low at 1.04733. The high price extended to 1.05454 in the European morning session.
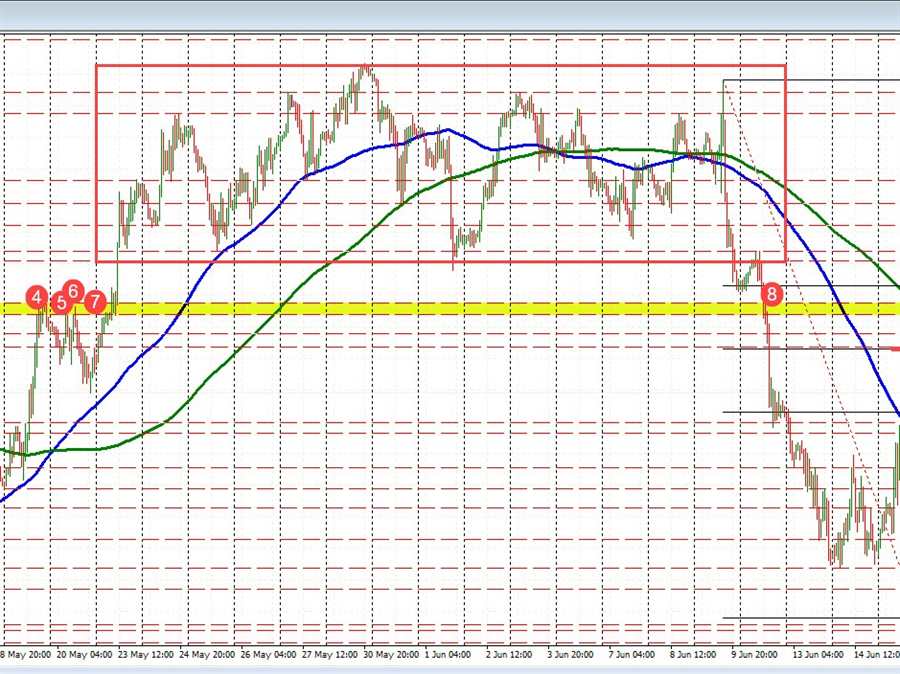
Looking at the hourly chart, the price moved to the upside was able to extend above its 200 hour moving average (green line in the chart above currently at 1.05252). There has been ups and downs through that moving average level as traders decide which way to push. The last hourly bar has seen the price move back above the 200 hour moving average line, tilting the bias a little more to the upside once again. However, with a number of other hourly bars above that have failed, staying above is still key.
On the topside, a move above the high for the day at 1.05454 would have traders looking toward the 50% midpoint of the June trading range. That level comes in at 1.05658. Last week, the price extended above the 200 hour moving average and 50% retracement on its way to a high of 1.06013. Getting back above the 50% retracement would open the door for a move toward that level.
On the downside, a move below 1.0500 would have traders looking back toward the 100 hour moving average 1.04733. Last Friday, the price dipped below the 100 hour moving average to a low of 1.04433, but could not sustain momentum and rotated back to the upside.
Overall, the market is trying to decide whether to tilt more to a positive bias or negative bias with the 200 hour moving average as the barometer. However with all day trading in the US, the market has a bit reluctant to make commitment (or so it seems at the moment).
