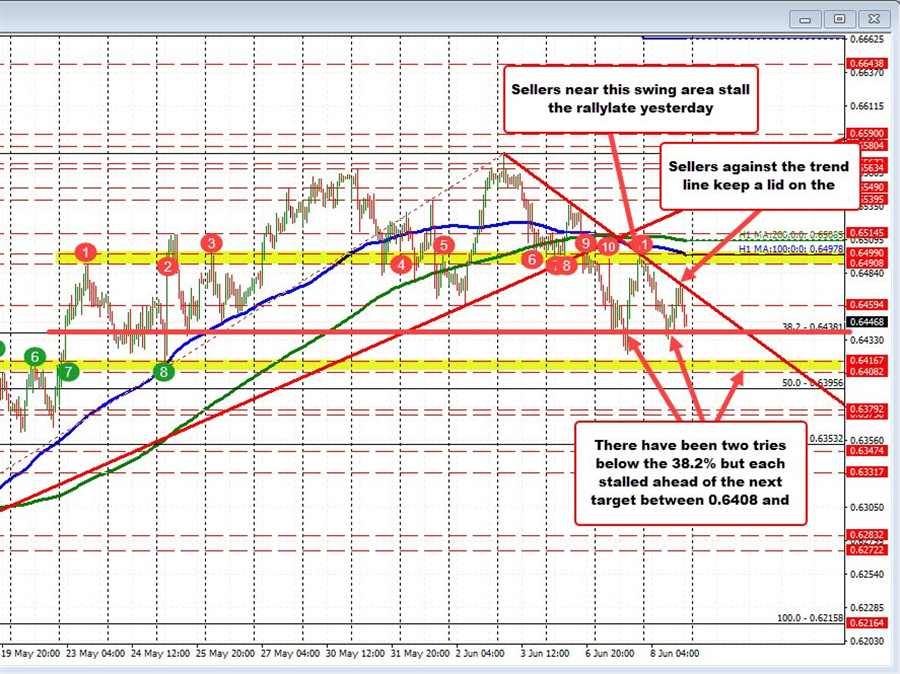
The NZDUSD moved lower in the Asian session after rising up to a swing area between and 0.6490 and 0.6499 before the close yesterday (see red numbered circles and yellow area).
The high price reached 0.6494. The subsequent move to the downside saw the price extend toward the 38.2% retracement of the move up from the May 12 low. That level comes in at 0.6438. The low for the day reached 0.6434.
A rotation back to the upside ensued with the price re-visiting a downward sloping trendline. Sellers of leaned and pushed the price back down toward the familiar 38.2% level.
A move below the 38.2% at 0.64381 would be the 3rd try and have traders looking toward the next swing area between 0.6408 and 0.64167 (see green numbered circles). So far declines have stalled ahead of that next target which has dissected bullish and bearish recently. Below that the 50% midpoint of the move up from the May 12 low comes in at 0.63956.
Overall, the last 4 trading days has seen a steady move to the downside with lower highs keeping a lid on rallies. The price has been able to stay below the downward sloping trendline and below a key swing area (see red numbered circles). The price is also moving away from the 100 hour moving average. All are bearish tilts at least in the short-term. Getting and staying below the 38.2% retracement is needed to give the sellers some credibility. Another failure below that level would certainly be a disappointment and likely lead to the sellers turn back to buyers once again.
