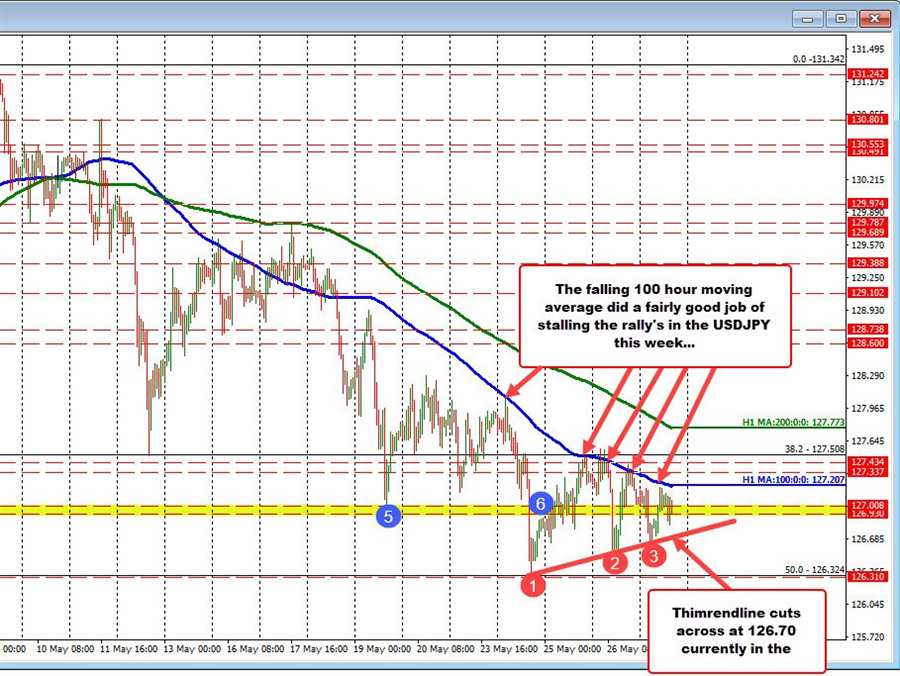
The UDSJPY has traded down and back up and trades modestly lower vs. the close from yesterday. The current price is trading at 126.94. The price closed at 127.07 yesterday.
Looking at the hourly chart above, the high price today reached 127.192. That was just short of the falling 100 hour moving average (blue line in the chart above). The current 100 hour moving average comes in at 127.207.
Of note, is that on Tuesday, Wednesday, Thursday and again today, the 100 hour moving average (blue line in the chart above) did a fairly good job of slowing of the rallies.
Yes…. there were moves above the moving average line yesterday (on 3 separate hourly bars), but momentum faded and the price moved back to the downside.
Going forward, getting above the 100 hour moving average with momentum would be needed to tilt the shorter-term bias back to the upside.
On the downside, the low price today stalled right against a upward sloping trendline connecting the low from Tuesday and the low from yesterday. That trend line currently comes in at 126.70. A break below that trend line would increase the bearish bias and increase the bears/sellers control.
In between sits a swing area between 126.93 and 127.008. The price has been trading above and below that area over the last 3 trading days as traders way for the next shove.
Going forward look for breaks of the technical levels outlined above and momentum on those breaks to help dictate the next move in the pair.
