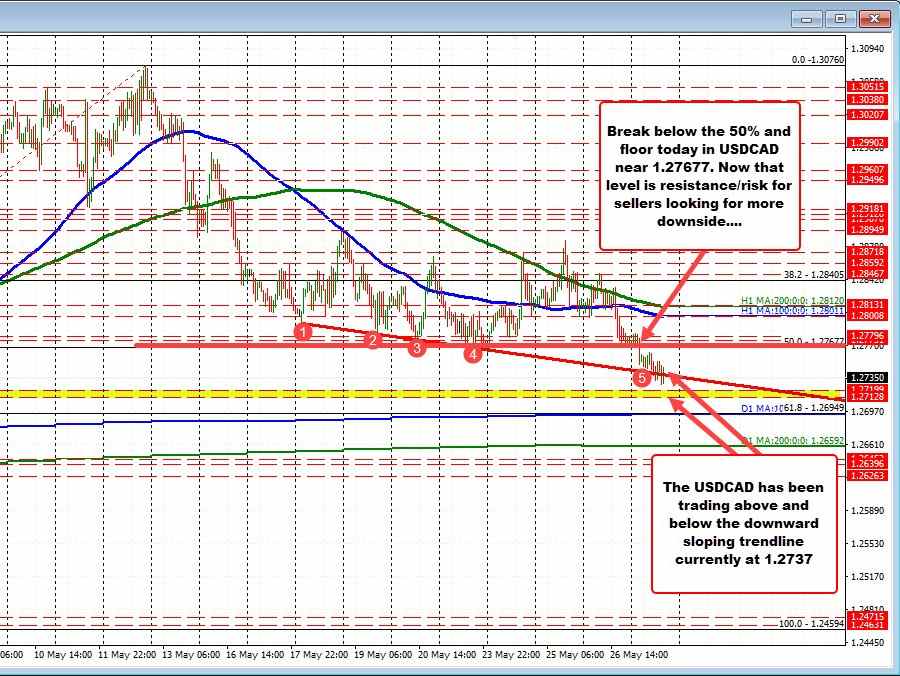
The USDCAD moved lower in the early Asian session and in the process broke below its 50% midpoint of the move up from the April 21 low. That level comes in at 1.27677. The price has stayed below that midpoint level since the break. Stay below the 50% retracement and the sellers remain in firm control.
On the move to the downside, the pair has been able to dip below a downward sloping trendline connecting lows from May 18, May 19th, May 20, and May 23 (see red numbered circles). That trend line currently cuts across at 1.2737 (and moving lower). The current price is trading at 1.2732. Sellers in control.
The next downside target targets 1.2712 to 1.27199 (see green numbered circles). Below that and the 100 day moving average comes back in play at 1.2695.
The price of the USDCAD has not traded below its 100 day moving average since April 22. The 61.8% retracement of the move up from the April 21 low also cuts across right near that 100 day moving average increasing the levels of importance going forward. It would be a key barometer for both the buyers and sellers looking for more downside. Be aware.
