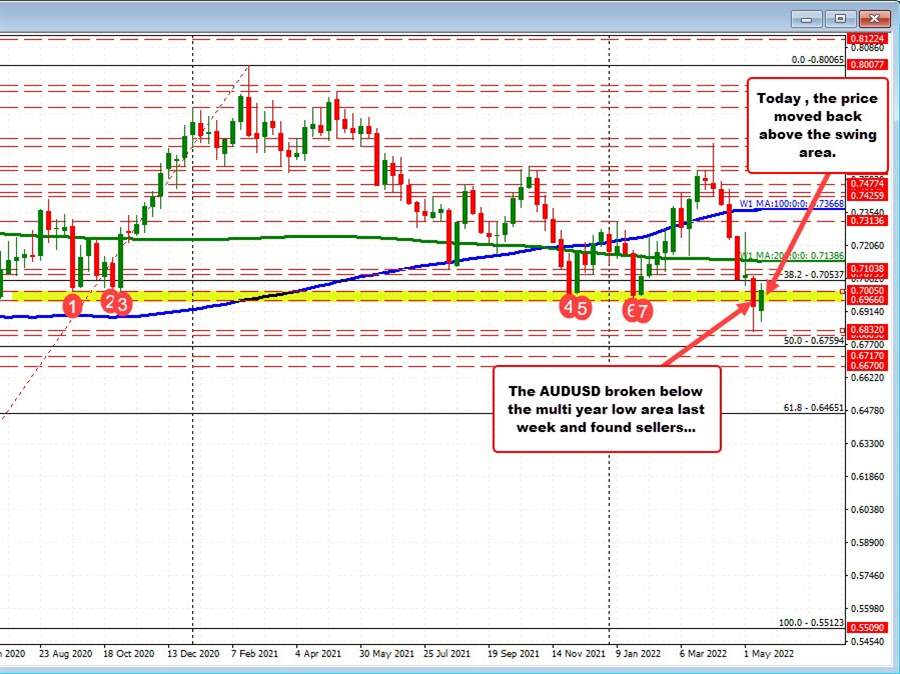
The AUDUSD moved to the lowest level since June 21, 2020 last week, and in the process broke below swing lows from September 2020, October 2020, November 2020, November 2021, December 2021 and the January 2022 between 0.6966 and 0.7005 (see red numbered circles in the chart above).
The breaking of that floor area (see red numbered circles in the chart above) gave sellers the go-ahead to probe lower and they took the pair to a low of 0.6828 toward the end of day on a Thursday. The price did rebound into the end the week and closed at 0.69374 on Friday.
Drilling to the hourly chart below, the bounce off the low on Thursday saw the price move above its 100 hour moving average into the close on Friday. On Monday, the price moved back below the aforementioned 100 hour moving average. However, the low price on Monday’s trade did fine support against swing lows from Friday ahead of the extreme low from Thursday.
The subsequent move back above the 100 hour moving average was supported by buyers against that moving average (see blue line in the chart below). The holding of support gave the buyers the go ahead to push the price higher into the close.
In trading today, the higher 200 hour moving average (green line in the chart below) was broken in the Asian session and has stayed above that level. Bullish.
The 38.2% retracement of the move down from the May high at 0.69954 was also broken. That retracement level is holding support on the US session dip – ahead of the 200 hour MA. Bullish
Those technical levels will be eyed for bullish/bearish technical clues.
If support can hold against those levels, the buyers can remain in control. A move below, and all bets are off for further upside momentum.
Of note is that the 200 hour moving average at 0.6974 – and moving lower – is getting closer to the low of the swing area from the weekly chart at 0.6966. That increases the areas importance for both buyers and sellers. It should also give the buyers a stronger level to buy against on a dip. Him him
Be aware
