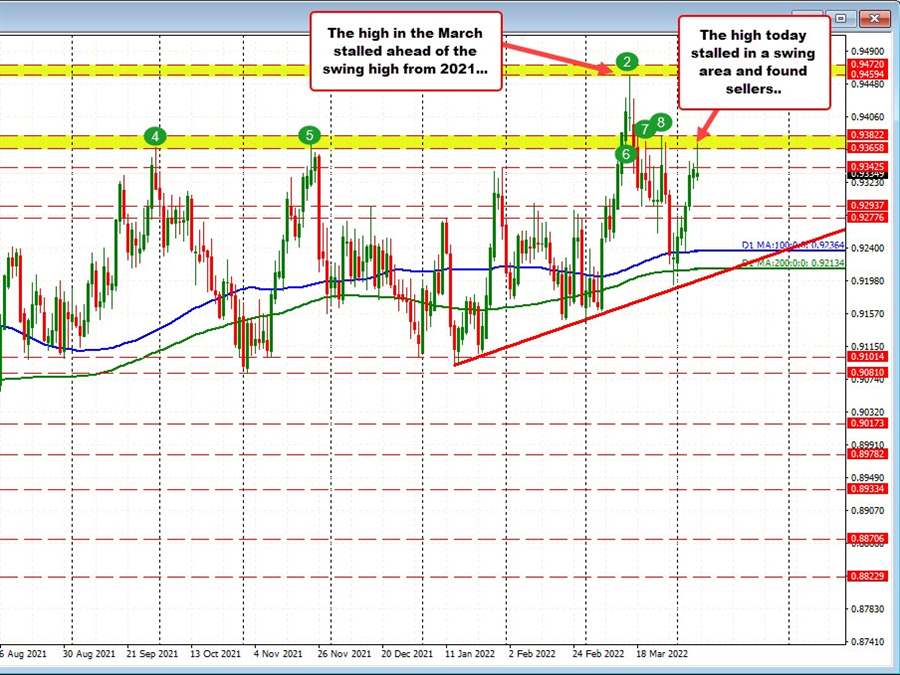
The USDCHF moved up on the daily chart extending to a new high for the week in the process. However, that high moved into a swing area (see green numbered circles) between 0.93658 and 0.93822. The high reached 0.9373 and rotated back down. The last 5 highs in the GBPUSD had stalled within that range area. Why not today too?
The holding of that level once again is just another notch in increasing that levels importance going forward. Next week be aware. If there is a break, the price should extend higher toward the highs from 2022 and 2021 in the 0.9459 to 0.9472 area.
For now, however, the sellers once again are giving the sellers some confidence.
Drilling down to the USDCHF hourly chart below, the run to the downside erased the gains and moved lower on the day. The low price, however, did find support buyers near the 50% midpoint of the move down from the March 16 high. That level comes in at 0.93268. The current price is at 0.9340.
What now?
For the week, the price has been moving higher since basing near the 100 day MA down near 0.9236. We know the high stalled near recent swing highs between 0.9366 to 0.9382, but the 50% midpoint of a move is always an important barometer for buyers and sellers.
I am not surprised the buyers on the dip today, came in against that level. IT makes sense.
However, if broken going forward/next week it should give the sellers more confidence and have them looking toward the 100 hour MA at 0.93118 (and moving higher). Move below that level and more selling could see the 200 hour MA in traders sites at 0.92844.
