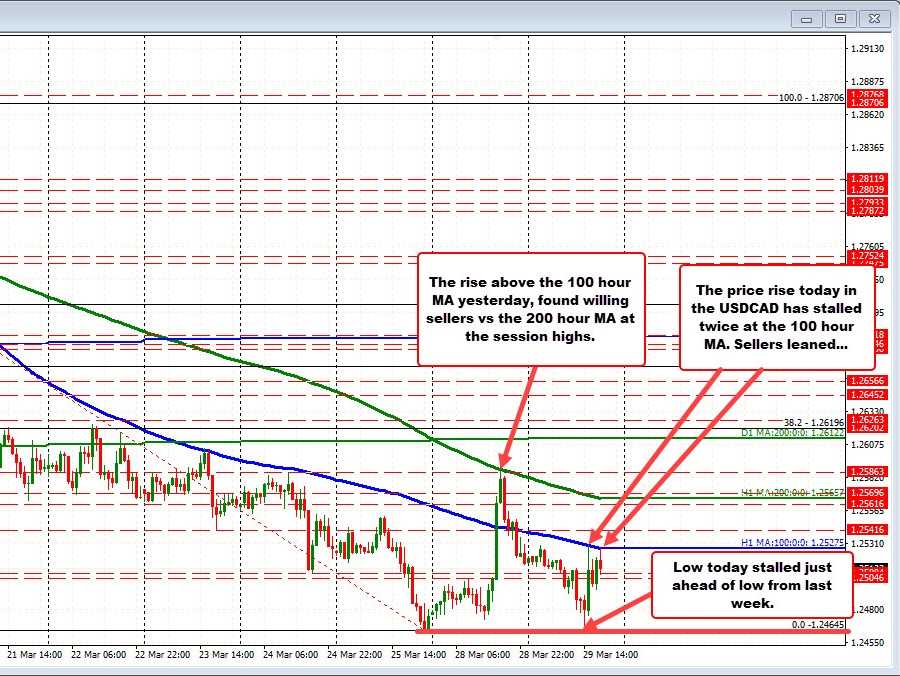
The USDCAD yesterday moved above it’s 100 hour MA (blue line). That was the first break of the MA since March 15. The price break saw the pair move up to the next key MA level at the 200 hour MA (green line). That MA did hold resistance and buyers turned back to sellers.
The subsequent move lower saw the price move back down to test the cycle lows from last week at 1.24646, but found support buyers. Since then, the price rise has seen a move back toward the falling 100hour MA (blue line) currently at 1.25275. That MA has now been tested twice – including the current hourly bar – and each time found sellers (so far).
A move above would once again have traders looking toward the 200 hour MA at 1.2565 (and moving lower).
The dynamics technically are the MAs have caught up to the price and in a way force the “market” to make a decision. Stay below and ultimately move lower, or move above, and tilt the technical bias more to the upside. The run higher yesterday took a step above the 100 hour MA, but failed at the 200 hour MA. Today, the 100 hour MA is trying to hold resistance. However, there is also support at recent lows.
The battle is on. The lines have been drawn in the sand. It is up to the buyers or sellers on who wins the battle.. Traders will be looking for a break with momentum on the break.
