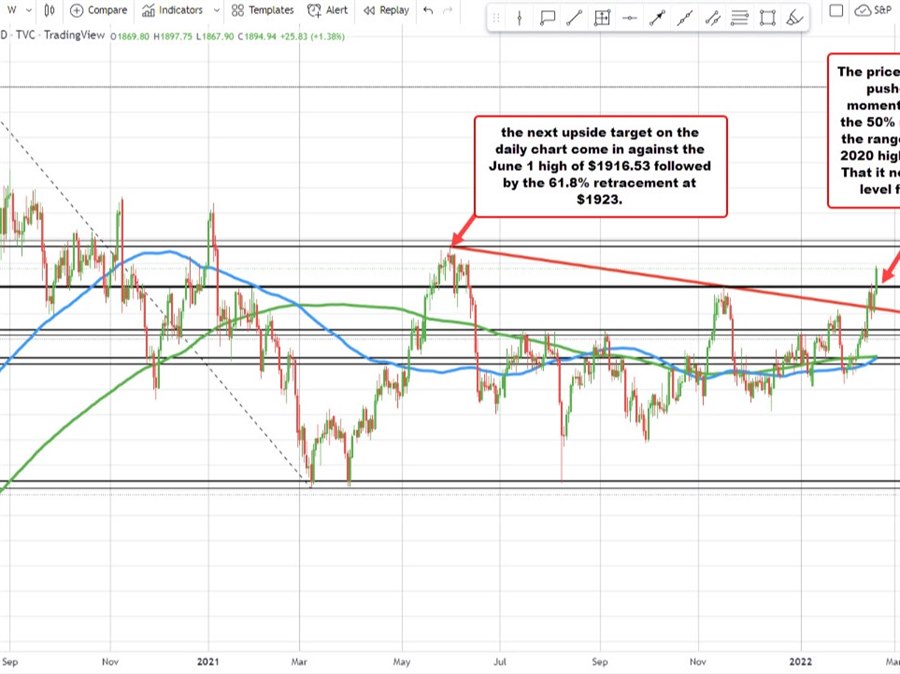
The price of gold is trading up $24.60 or 1.32% at $1893.70. The price is being pushed higher on flight to safety as Russian/NATO/US tensions increase. The respective parties are not getting any closer toward a friendly agreement.
Looking at the daily chart, the price has now moved above the 50% midpoint of the move down from the August 2020 high. That level comes in at $1876.02. Earlier this week, the price stalled near that level and backed off.
The next key upside target on the daily chart comes in at the June 1, 2021 high price at $1916.53. The 61.8% retracement of the same move lower comes in at $1923.01
Drilling to the hourly chart below, the low prices on Wednesday and again on Tuesday stalled right near its 100 hour moving average (blue line in the chart below). That kept the buyers in control, and helped to push the price back toward the 50% midpoint on the daily chart near $1876. The move up to that level initially found some stall, but once the level was broken with momentum, the sellers gave up in the buyers took over.
