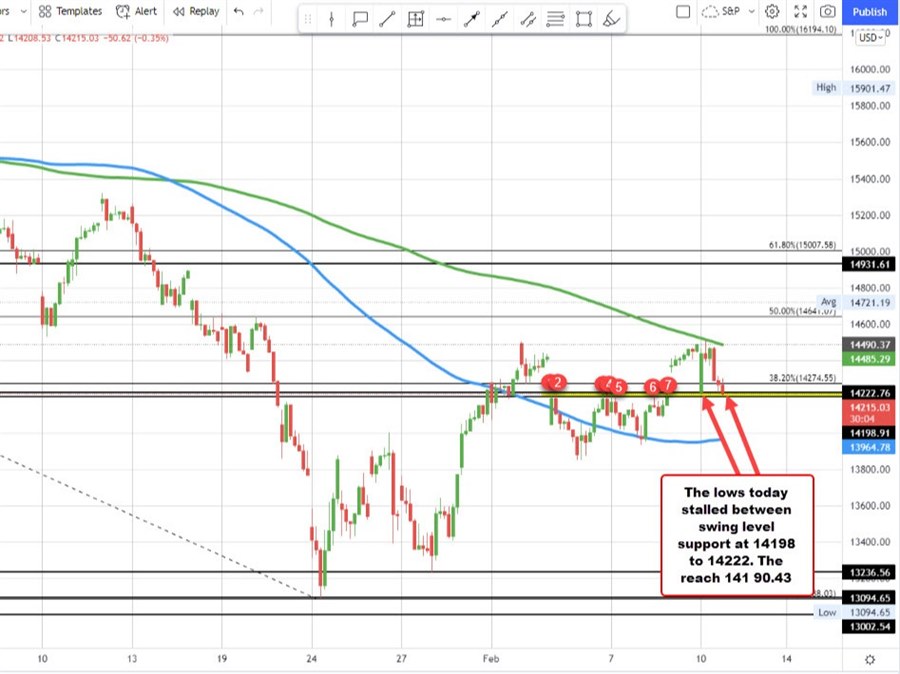
The
NASDAQ index is trading at session lows at 14198.78. That price is testing a swing area between 14198 and 14222.
The level corresponds with swing highs from February 2, February 7, February 8, and the low from earlier in the day.
Yesterday, the price gapped above that swing area and today, the price rebound off of the initial low, and found sellers against its 200 hour moving average (green line in the chart above). Sellers leaned against that moving average level, and have pushed the price down in four of the last five hourly bars.
Going forward, move below 14198 with momentum, and traders would start to look down toward the 100 hour moving average at 13964.79 as the next key target .
This article was originally published by Forexlive.com. Read the original article here.
