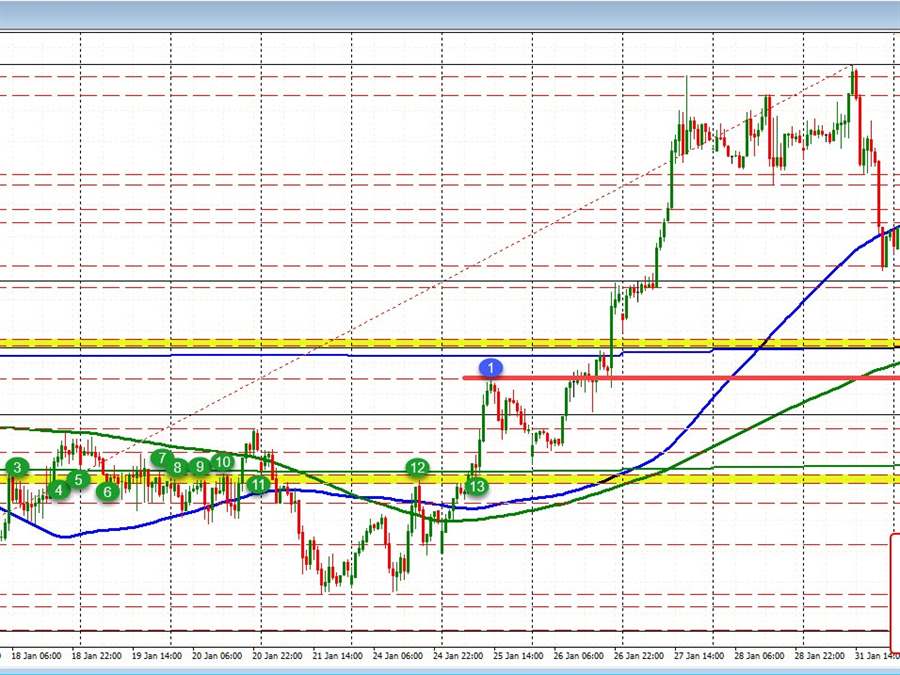
The USDCHF is on its third consecutive down day after the high on Monday took out the high from last week but only by a few pips.
The move to the downside has seen the pair moved below the 100 hour moving average currently at 0.9271, the 200 hour moving average currently at 0.9222, and the 100 day moving average currently at 0.9217.
In trading today, the high price was able to extend above the 100 day moving average and 50% midpoint of the 2022 range near 0.9217, but stalled right at the 200 hour moving average before moving back to the downside. Bearish.
A move below 0.9203 (swing high from January 25 and swing lows from yesterday and earlier today) held resistance in the early North American session. That level is close risk intraday. Stay below is more bearish. On the downside, the move is getting closer to the broken 200 day moving average at 0.9165. Back on January 25, the price moved above that level and stayed above that level since that break.
Looking at the daily chart, the USDCHF has been moving up and down between 0.9081 and 0.9375 since August 2020. Admittedly, the price has chopped above and below the 100 and 200 day moving averages since October. Looking at the daily chart, the higher lower extremes near 0.9375 on the topside and 0.9081 on the bottom side of instead provided the ceiling and floor for traders over the last six or so months.
