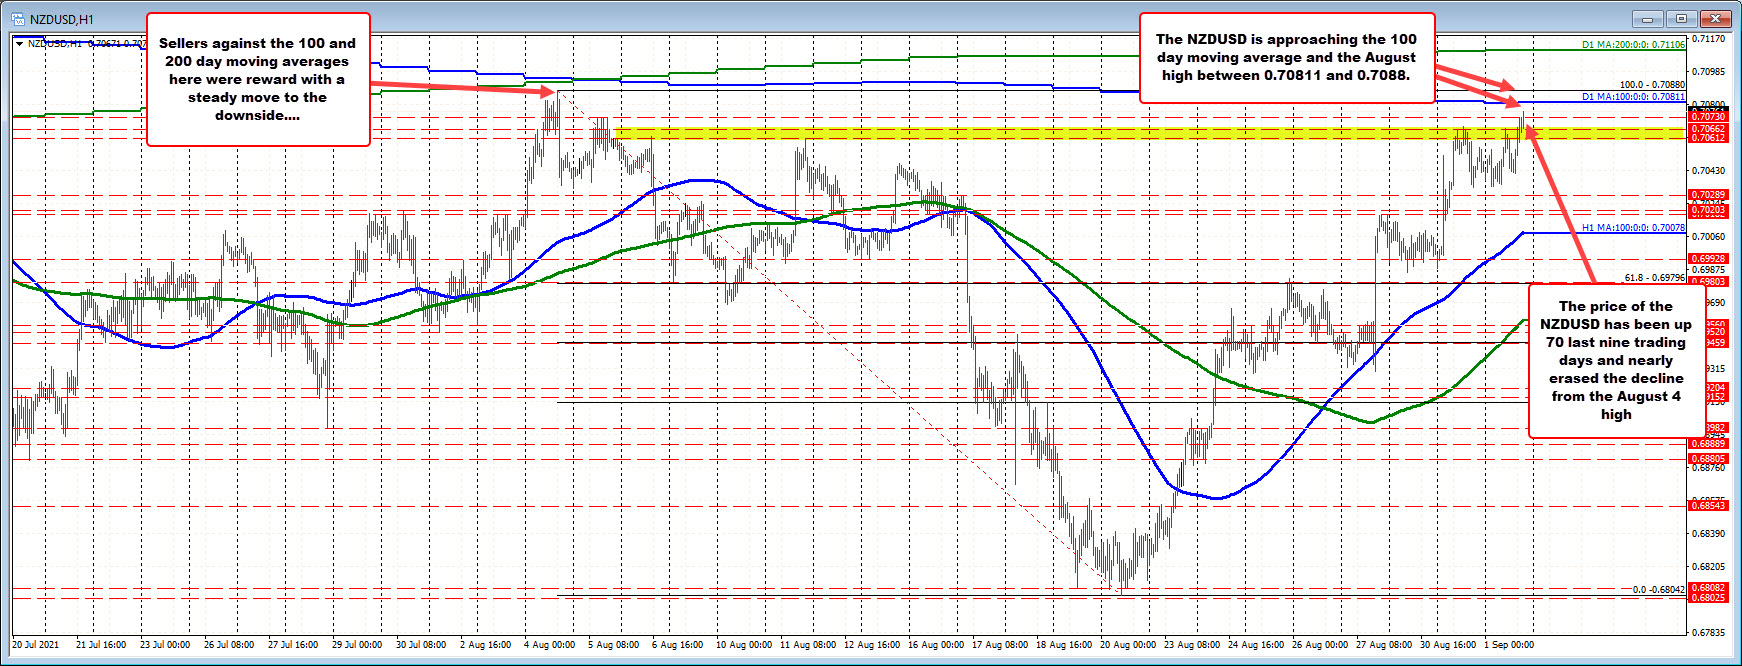
100 day moving average up near 0.70811
The NZDUSD has just moved to the highest level since August 4. That was the day that the price moved to the highest level since July 6. It also was the day that the price for the pair got close to the near converged 200 and 100 day moving averages. The moving averages back on August 4 were at 0.7092 and 0.7095. The high price reached 0.7088 – 4 to 7 pips short of those key moving average levels.
The subsequent fall, took the price all the way down to 0.6802 on August 20. Since then, the price has moved up six of the the last eight trading days. Today would be day seven of nine. That move has nearly erased the move down from the August 4 high. The high price just reached 0.70754 – just 13 pips short of the August high.
Between the high today and the high from August 4 sits the 100 day moving average at 0.70811 (PS the 200 day moving average has moved higher and currently is at 0.71106).
That 100 moving average and the high from August will be a tough nut to crack. There may be some cause for pause at least from the risk focused traders who will be happy to sell against the levels, with stops above.
If the price does move above the moving average and the August high, the 200 day moving average has moved higher and currently is at 0.71106. Move above that moving average and the technical bias turns even more bullish.
Close risk intraday now comes at the 0.70612 level. That was a swing high going back to August 11.
