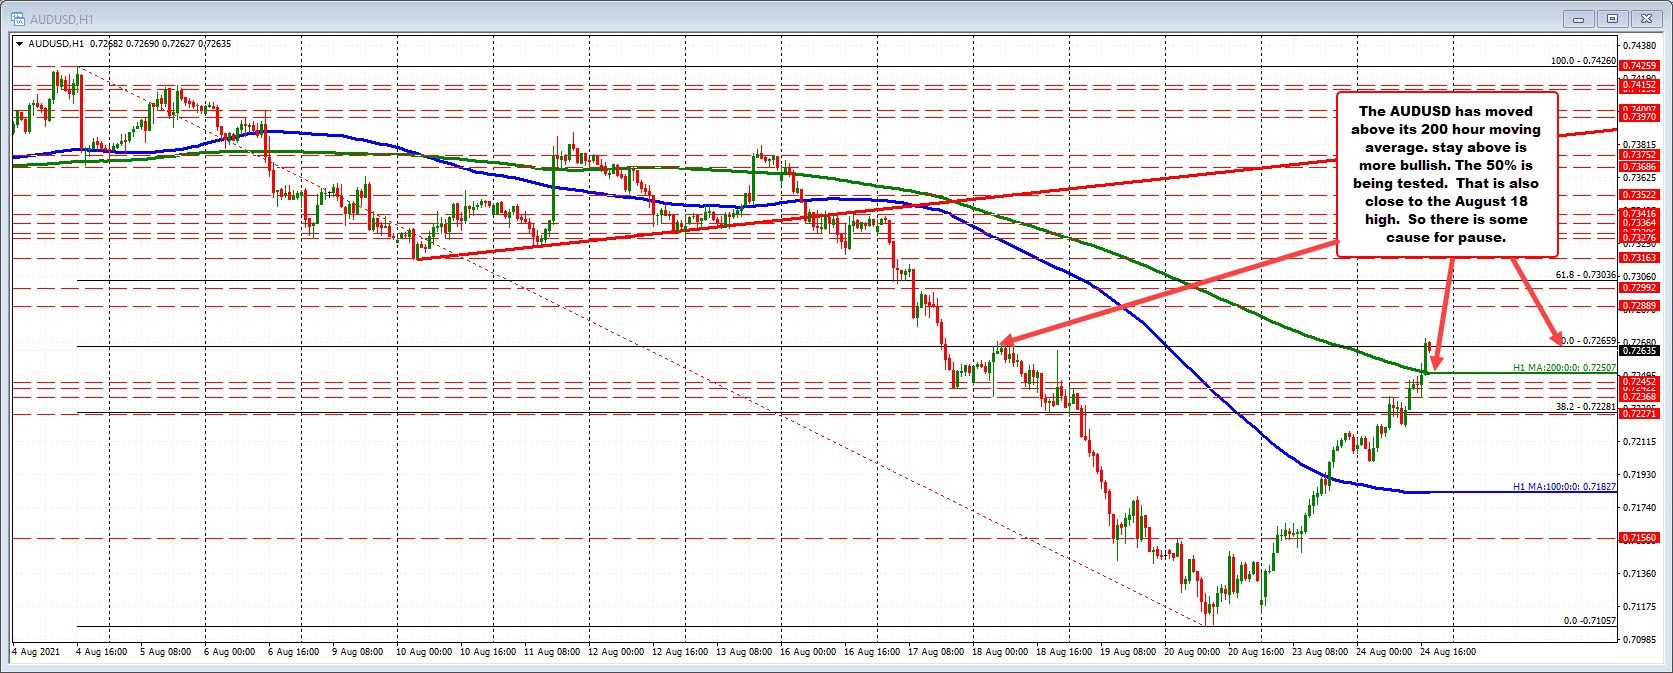
Midpoint of the August trading range comes in at 0.72659
The AUDUSD is working on its second up day in a row, after falling every day last week.
The move to the upside has now retraced 50% of the August trading range (from the August 4 high). It has also corrected 61.8% of the move down from last week’s 5 day decline (that is at 0.72703 – not shown in the chart above).
So the rebound over the last two days is strong and quicker than the decline. Helping of course is the rise in stocks, and hopes in China that the worst is over with regard to regulation and Covid.
Technically, the move to the upside today has also seen the price move above its 200 hour moving average (green line) at 0.72507. With the current price trading around 50% retracement at 0.72659, that moving average is now close risk for longs. It would not look too good technically if the price breaks above the 200 hour moving average and 50% and then starts to trade back below both of those levels.
