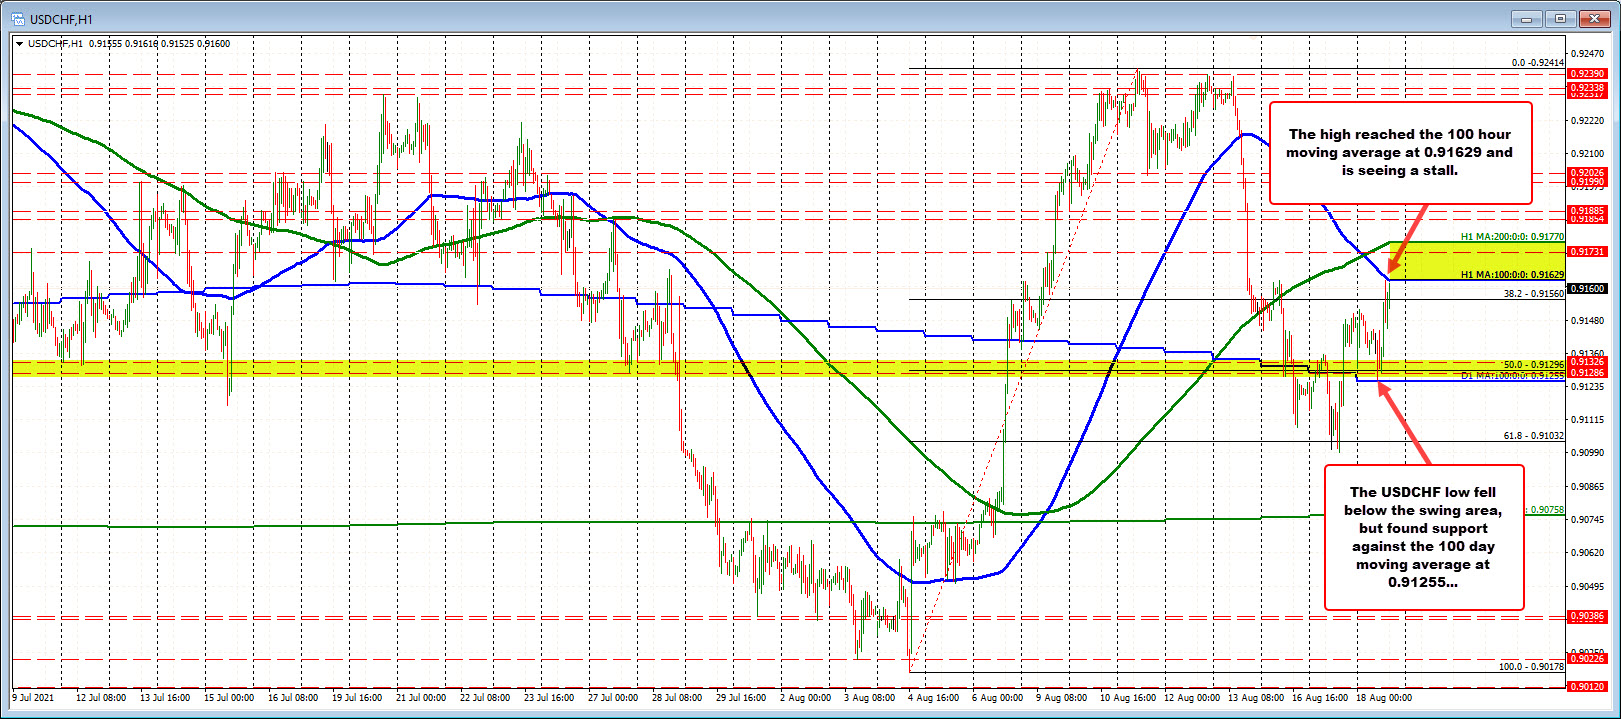
100 day MA below and 100 hour MA above
The USDCHF fell into the European morning session, and the move lower fell below a swing area between 0.91286 and 0.91326. The 50% midpoint of the range for August was also near that area at 0.91296.
However, just below those levels sat the 100 day moving average at 0.91255, and traders leaned against the lowest target and pushed the price back higher.
That move to the upside saw the price extend to new session highs for the day (above the Asian session high of 0.9152), but stalled near its 100 hour moving average at 0.91629 (the upper blue line in the chart above). The price has stalled against that level as traders leaned with risk defined and limited.
It will take a move above the moving average level to increase the bullish bias with the 200 hour moving average at 0.9177, the next upside target on a break higher.
Hold the resistance now, and the ping-pong between the moving averages is still in play. The Asian high came in at 0.9152. A move back below that level would give the sellers against the moving average some comfort and breathing room. Stay below and a rotation back to the lower support cannot be ruled out.
