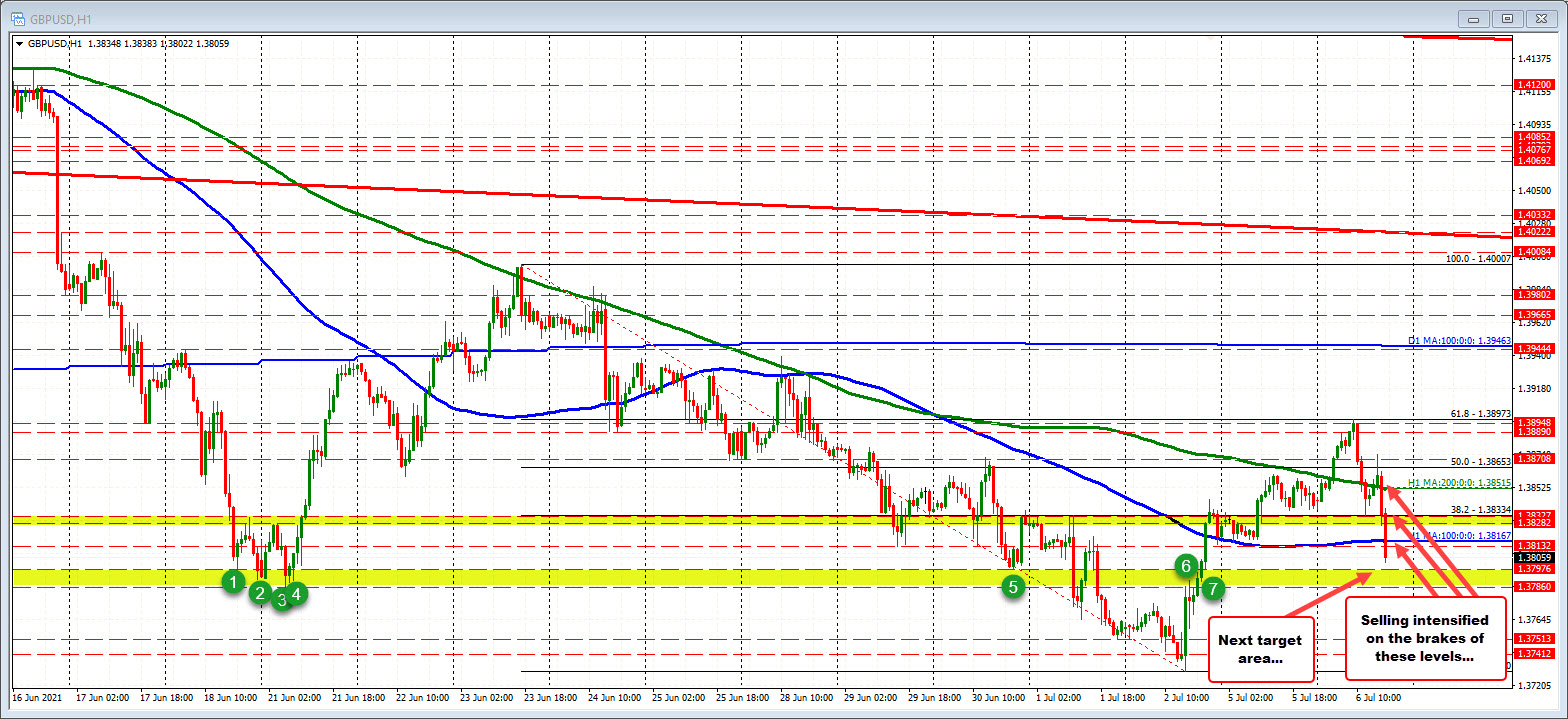
100 hour moving average at 1.3167
The GBPUSD took the clues from the technicals after early support near the 38.2% retracement held and the price rebounded back above its 200 hour moving average at 1.38515 (green line – see earlier post here).
The price moved back below its 200 hour moving average, and then the swing area/38.2% retracement near 1.3828 to 138334.
That move has now continued with the break of the 100 hour moving average at 1.38167. Recall from yesterday’s trade, that moving average held support before moving higher. Traders will now eye that MA as close resistance.
On the downside the 1.3786 to 1.37976 is the next support target to get to and through. Below that, and traders will be looking toward the lows from last week.
This article was originally published by Forexlive.com. Read the original article here.
