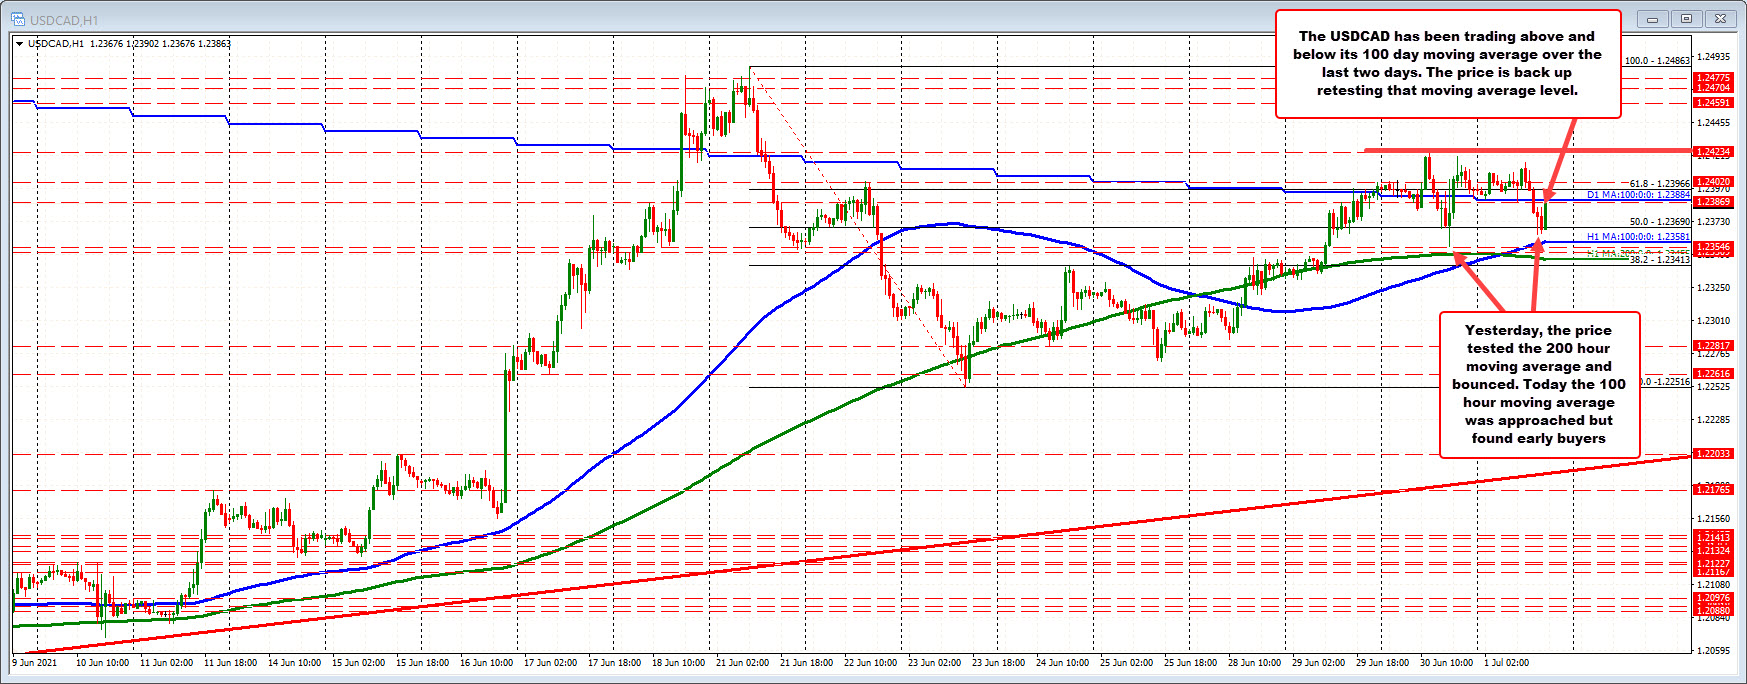
The 100 hour moving average could not be broken on the move lower
The USDCAD is lower on the day, and in the process broke back below its 100 day moving average of 1.23884. The price has been trading above and below that moving average over the last two trading days.
The move lower extended toward its rising 100 hour moving average currently at 1.23581, but found early buyers against the moving average level. Yesterday, when the 200 hour moving average was above the 100 hour moving average, the traders also leaned ahead of the technical level.
The move back to the upside has returned to retest the 100 day moving average. A move above would tilt the bias more to the upside once again. On a re-break, traders would want to see some follow-through buying to keep that bias tilt.
Holding below the 100 day MA now, would give sellers the upperhand intraday at least, with a return back toward the 100 hour moving average as a possibility. Breaking below the 100 hour moving average would then target the 200 hour moving average currently at 1.23456. Falling below that level, would open the downside for further downside probing.
Although the 100 day moving average has seen price action above and below over the last two days, if the level can hold resistance, it would give trades a clue as to the markets intention. Key test for both the buyers and sellers.
