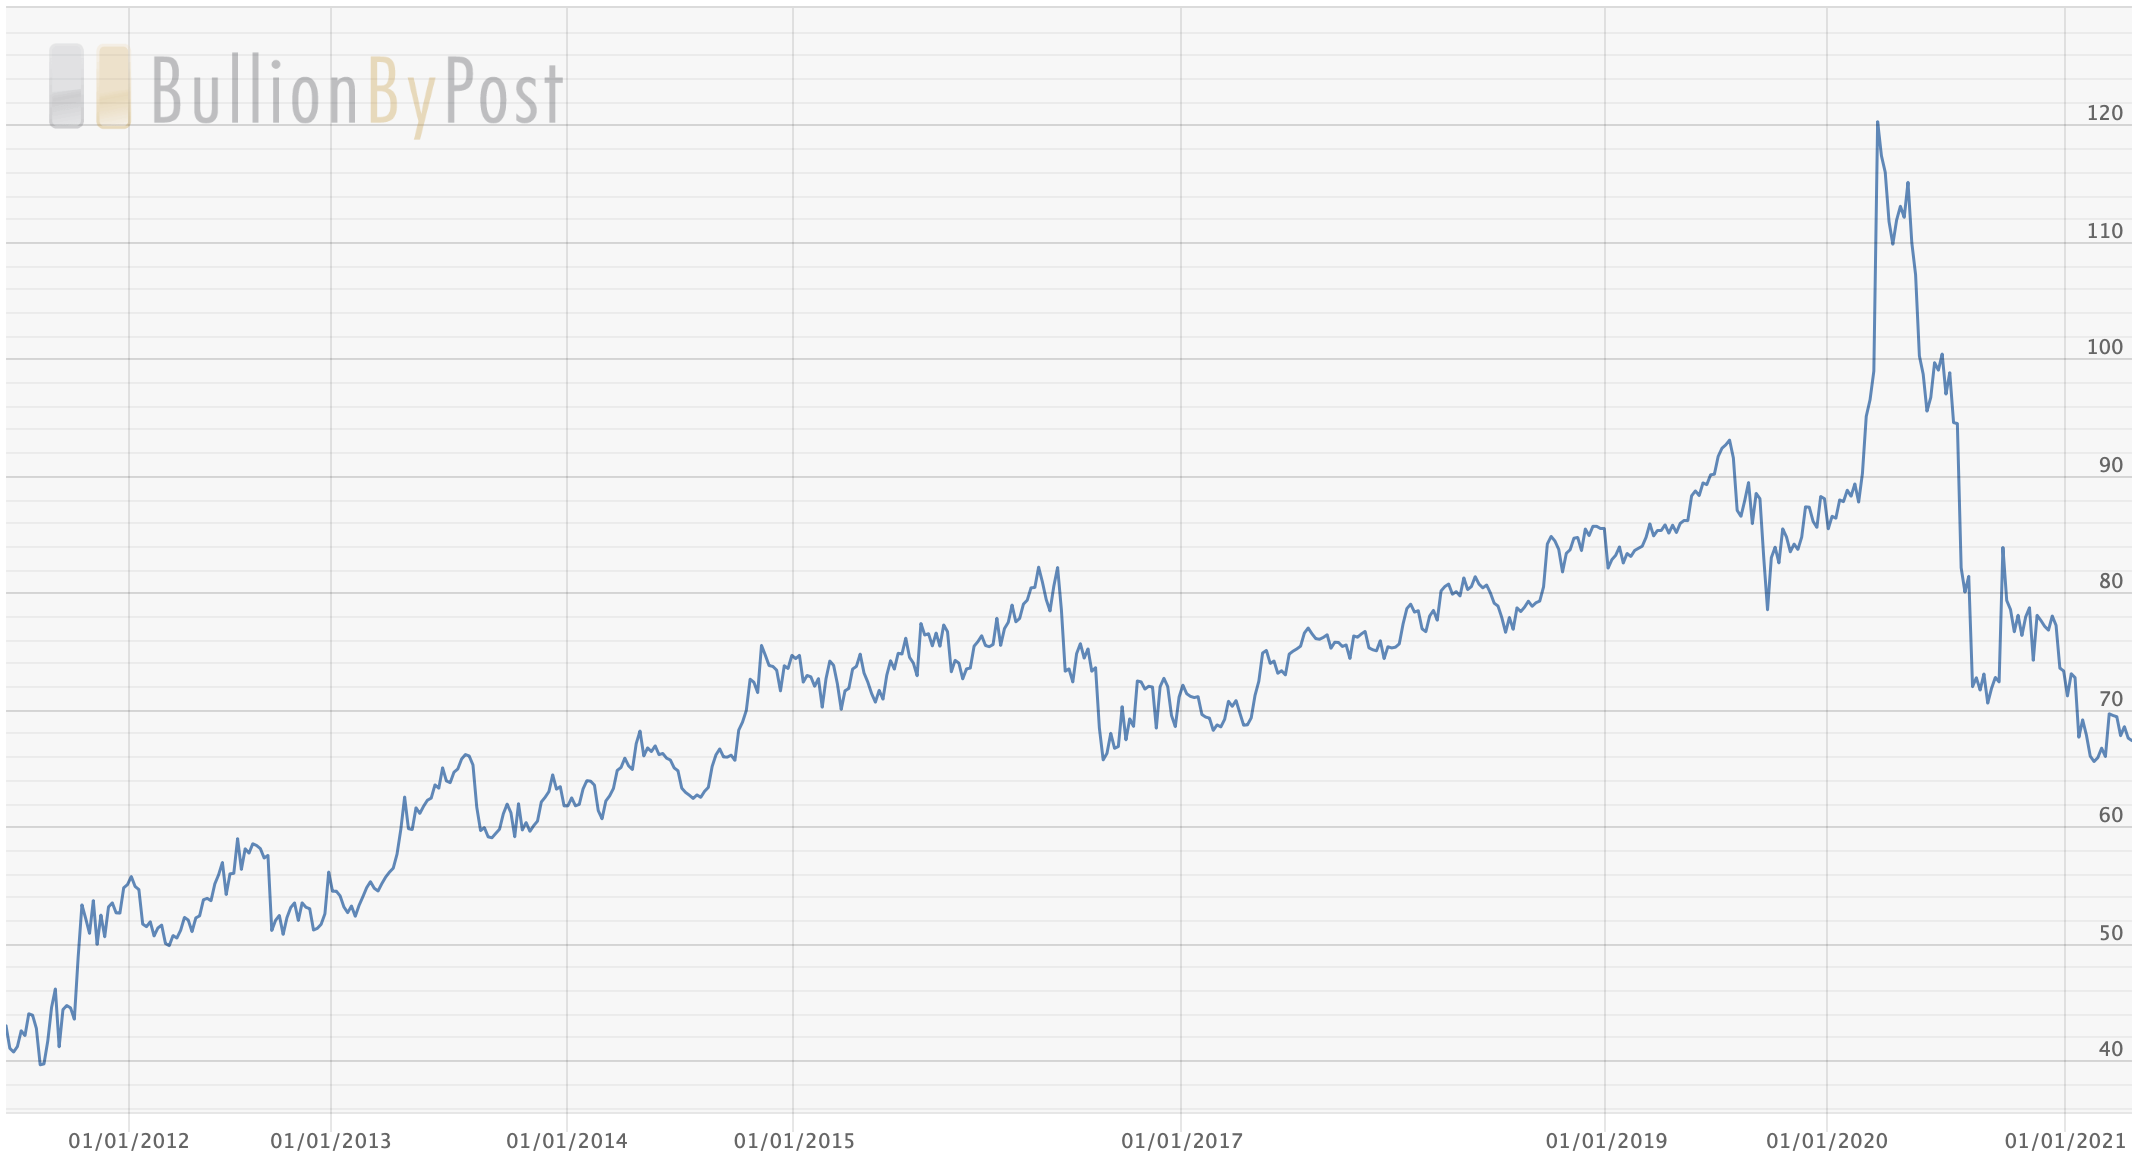
Gold silver ratio
The gold silver ratio is down near its 2016 lows.
What is it?
The gold to silver ratio represents the relative value of one ounce of silver to one ounce of gold. It is a weight for weight comparison. In basic terms the ratio shows you how many ounces of silver you would need in order to buy a single ounce of gold.
As an example let’s say gold is trading at $1000 per ounce and silver is trading at $10 per ounce. In this example you would need one hundred ounces of silver to buy a single ounce of gold. The gold silver ratio would be 100:1.
The ratio moves each day
Every day the ratio is changing as the price of gold and silver is changing. In order to calculate it you divide the price of gold by the price of silver. You can see now that when the gold/silver ratio is high it means that MORE silver is needed to buy one ounce of gold and silver is relatively cheap compared to gold. This was the case last year when the gold silver ratio was up well over 110.
Conversely, when the gold silver ratio is low it means that LESS silver is needed to buy one ounce of gold and silver is relatively expensive compared to gold.
How to use it
Some analysts, traders, and investors look to “trade the ratio”, buying silver when the gold/silver ratio is high and switching to gold when it falls. If inflation risks rise, and the Fed stays bearish, then precious metals offer good value. Looking at the gold/silver ratio can help you either a) choose between silver and gold or b) allocate your positions between silver and gold
