As US yields moved to the downside with the two-year down -5.4 basis points in the 10 year down -5.0 basis points (they were up earlier today), the US stocks have moved sharply to the upside.
The gains are being led by the NASDAQ index which is up near 2.5%. The current price is up 274 points or 2.5% at 11258.62. The S&P index is up 56 points or 1.42% 4013.99. The Dow industrial average is up for 268 points or 0.79% at 34119.
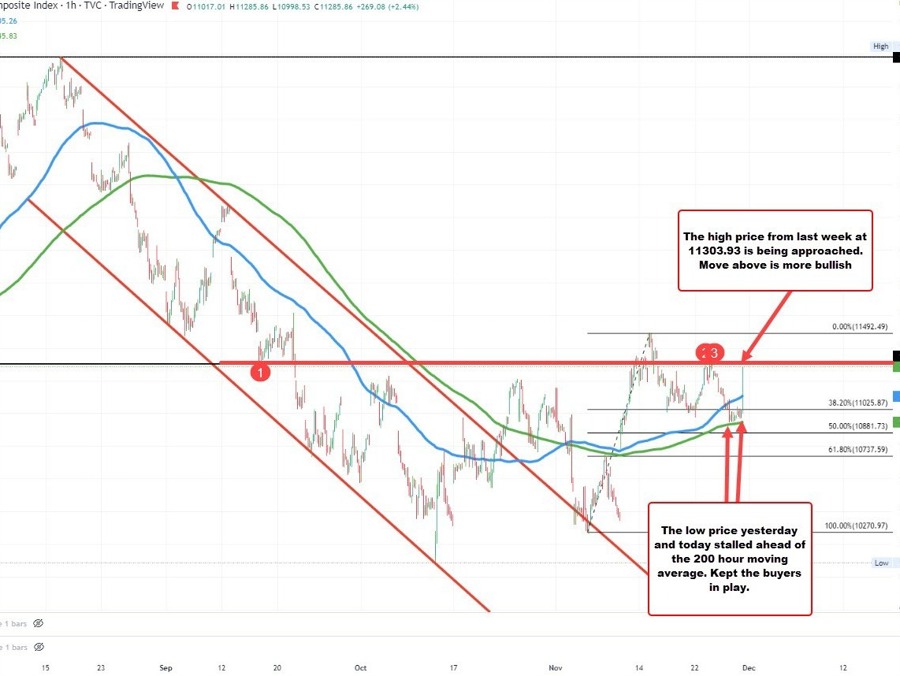
NASDAQ index moved away from its hourly moving averages
falcon shipped you
For the NASDAQ index is approaching the high price from last week at 11303.93. The high price has reached 11274.99. Looking at the hourly chart, the low prices today and yesterday stalled just ahead of the 200 hour moving average (green line in the chart above). The chairs comments pushed the price back above the 100 hour moving average at 11105.14 (blue line in the chart above).
For the S&P index, it is back reproaching its falling 200 day moving average which currently comes in at 4050.07. The price is currently trading at 4034.. The high price reached 4037.22. A move above would be the first break since April 2022.