200 hour MA and 38.2% tested
Looking at the hourly chart, the pair stayed mostly above its 100 hour moving average this week (until today). It also traded above its 100 day moving average on and off this week, which was bullish. That moving averages currently at 1.37965.
However, at the highs reached on Monday, Tuesday and Wednesday the price stalled near 1.3833 on each of those days creating a triple top and a solid ceiling. That ceiling also was able to stay below the 200 day moving average (top green line) at 1.3461. Bearish.
With the move lower off the EU headlines, the pair has made a run to the downside. In the process the action has now taken the price away from the 100 hour moving average at 1.2789 (bearish), and away from the 100 day moving average at 1.37965 (bearish), and also further away from the 200 day moving average at 1.3846 (bearish – which was never touched this week).
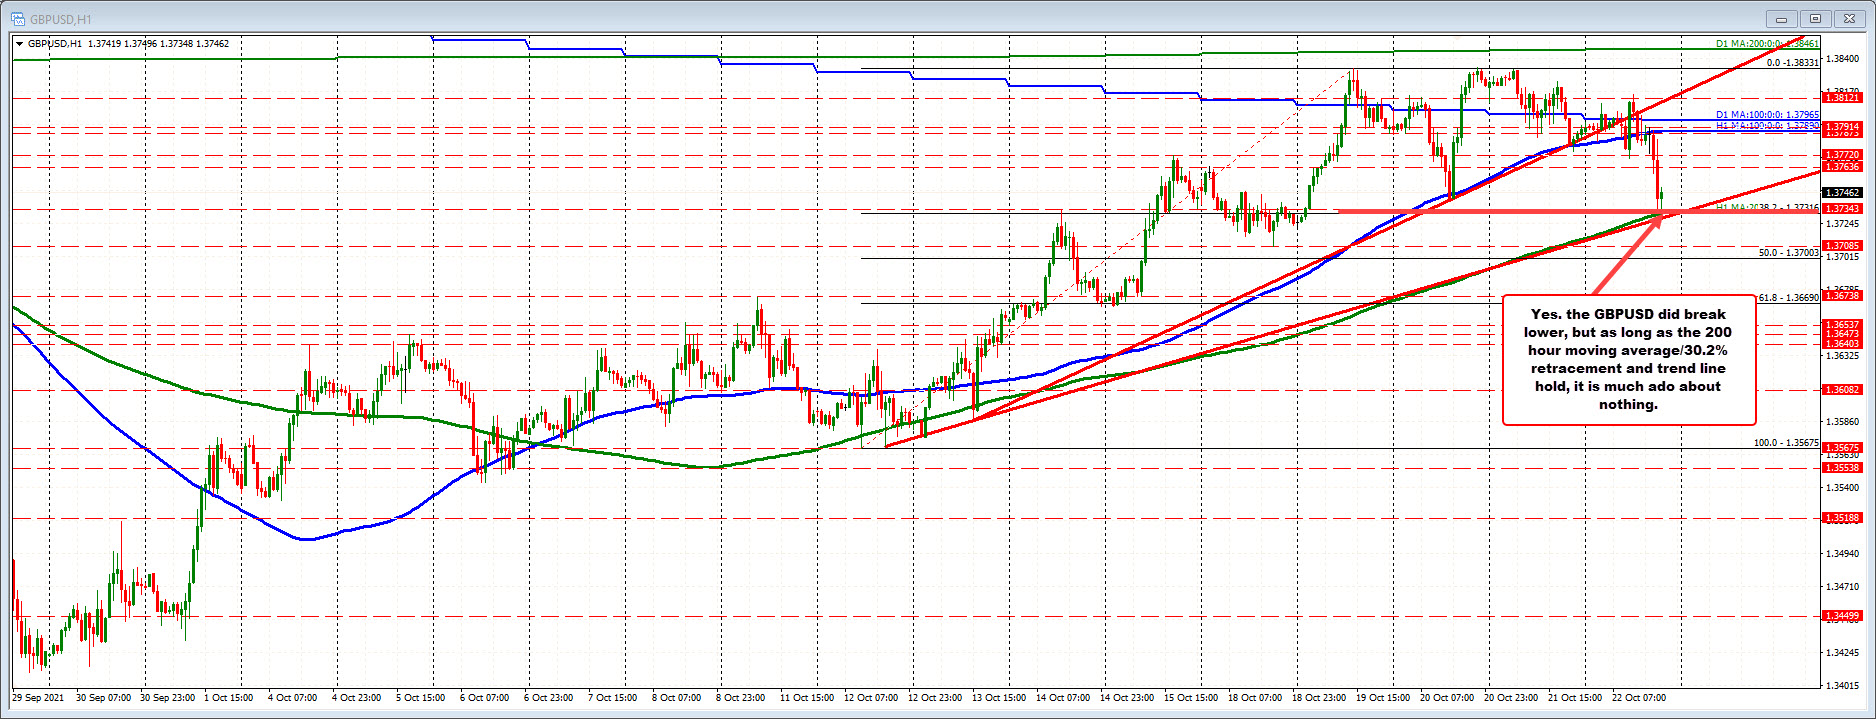
The pair’s decline has taken the price down to test its 200 hour moving average and 38.2% retracement of the move up from the October 12 swing low. Both of those technical targets come near the 1.37316 level (a rising trendline also cuts across right at that level). Those lows have so far held support which is good news (bullish)
Additional good/bullish news is that the price is still also above its low from Monday near 1.3708, and the 50% retracement of the move up from the last swing low on October 12 at 1.3700.
Now admittedly , breaking those levels would increase the bearish bias more.
For now however, the move lower is a step in the bearish direction, but it is also “much ado about nothing” as long as the support from the 200 hour moving average and 38.2% retracement near 1.37316 holds. If it does, a move back toward the higher levels near 1.37636 to 1.3772 is not out of the question, and if broken, a retest of the 100 hour moving average and 100 day moving average would be the next targets.